Is it time to recalibrate your marketing budget? Here’s where ecomm leaders are investing the most—and least—in 2023

Ecommerce has come a long way from the “email is dead” narrative.
Email marketing is the No. 1 most-used marketing channel among businesses of all sizes—and over half of businesses that make $20M+ in annual revenue use SMS for marketing, according to a new survey from Klaviyo and Qualtrics.
Based on responses from 750+ ecommerce marketing executives in the US and Canada, the survey also found that paid advertising continues to guzzle marketing dollars: Across all business segments, paid social and paid search consistently earn the largest average portion of marketing budgets.
Clearly, paid advertising is still a primary avenue for growing and retaining your customer base. But with email in the top 5 channels in every survey category and SMS gaining traction among leading brands, another message stands out just as prominently: Moving forward, owned marketing will continue to grow alongside the brands that invest in it.
“Owned marketing is not dead, but rather requires a renewed focus on building relationships the right way, at the right time,” says Meagan Dollins, director of partner marketing at BigCommerce. “This means evaluating where your customer is in their journey with your brand.”
Owned marketing is not dead, but rather requires a renewed focus on building relationships the right way, at the right time.
In the midst of a historic economic downturn, making smarter decisions around marketing reporting and resources is a critical component of ecommerce success. Is retention really the new acquisition? Is it time to pull back on paid advertising? How much should you invest into which channels—and which channels can you rely on to turn a profit?
Klaviyo’s 2023 marketing mix survey set out to discover how ecommerce businesses of all sizes are putting together their marketing mix for 2023—so that you can make more efficient budgeting decisions based on what’s best for your brand.
The 2023 marketing mix report: survey demographics
We surveyed 750+ ecommerce executives involved in marketing budget allocation and strategy across various industries. Here’s how the demographics break down:
By industry
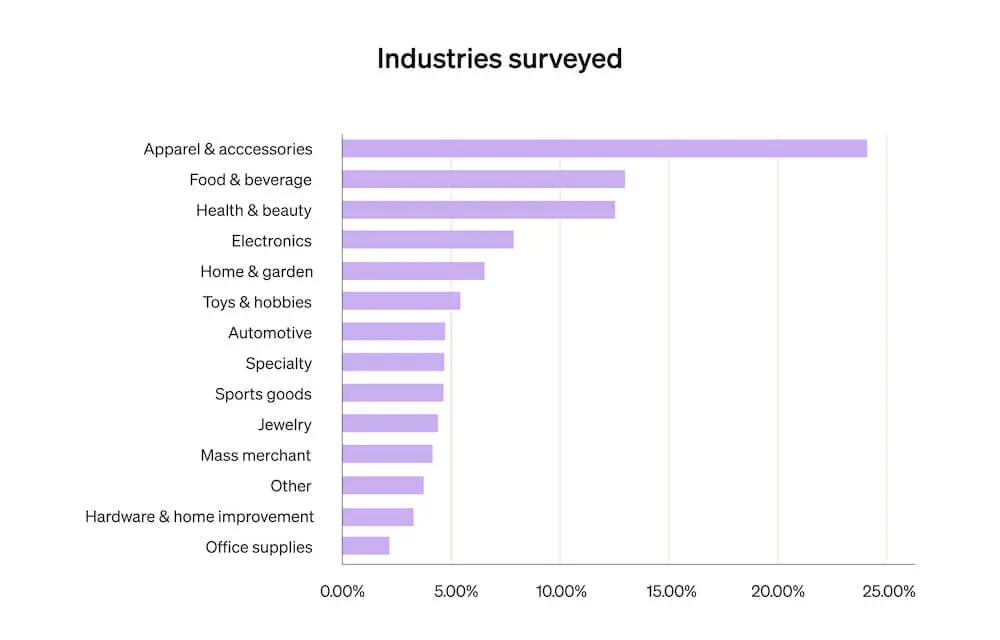
The majority of survey respondents work for businesses that operate in the following industries:
- Apparel + accessories: 24.24%
- Food + beverage: 12.48%
- Health + beauty: 12.12%
- Electronics: 7.49%
By role
Respondents—the majority (83.19%) of whom are “highly involved” in marketing budget allocation decisions—are employed in the following roles at their companies:
- Manager and up: 90.34%
- Director and up: 67.86%
- Executive level: 44.96%

By business size
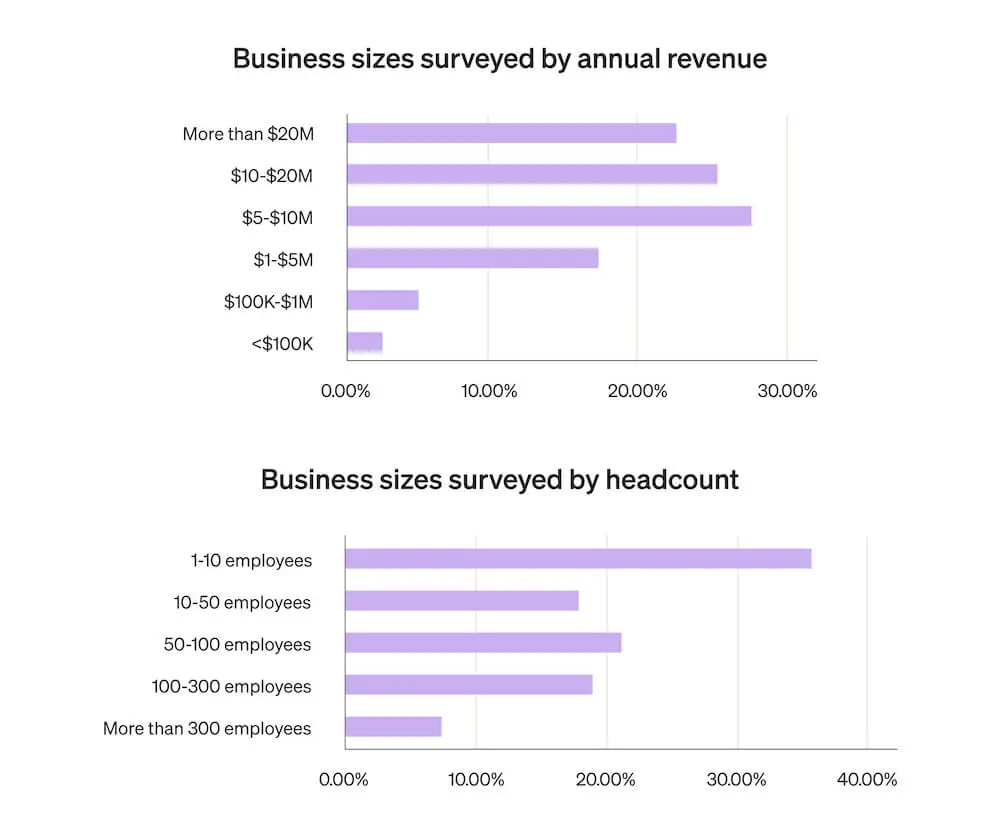
The companies surveyed report the following annual business revenue:
- $20M+ (mid-market): 22.6%
- $1M-$20M (SMB): 69.36%
- <$1M (entrepreneur): 8.06%
The companies surveyed report the following employee headcounts:
- <50: 53.4%
- 50-100: 21.06%
- 100+: 25.53%
How marketing budgets are shifting under economic pressure
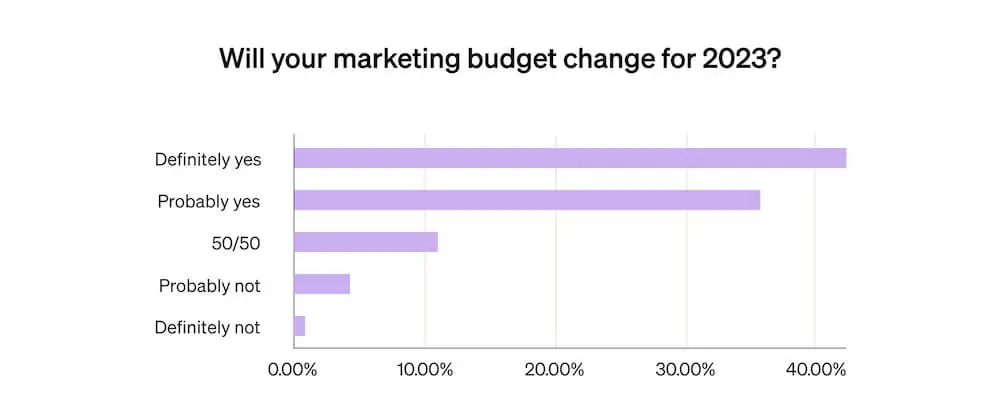
85.09% of ecommerce businesses will make changes to their marketing budgets amid economic uncertainty in 2023.
In response, 33.26% of brands plan to spend $201K-$400K monthly, while 13.22% will spend <$25K per month.
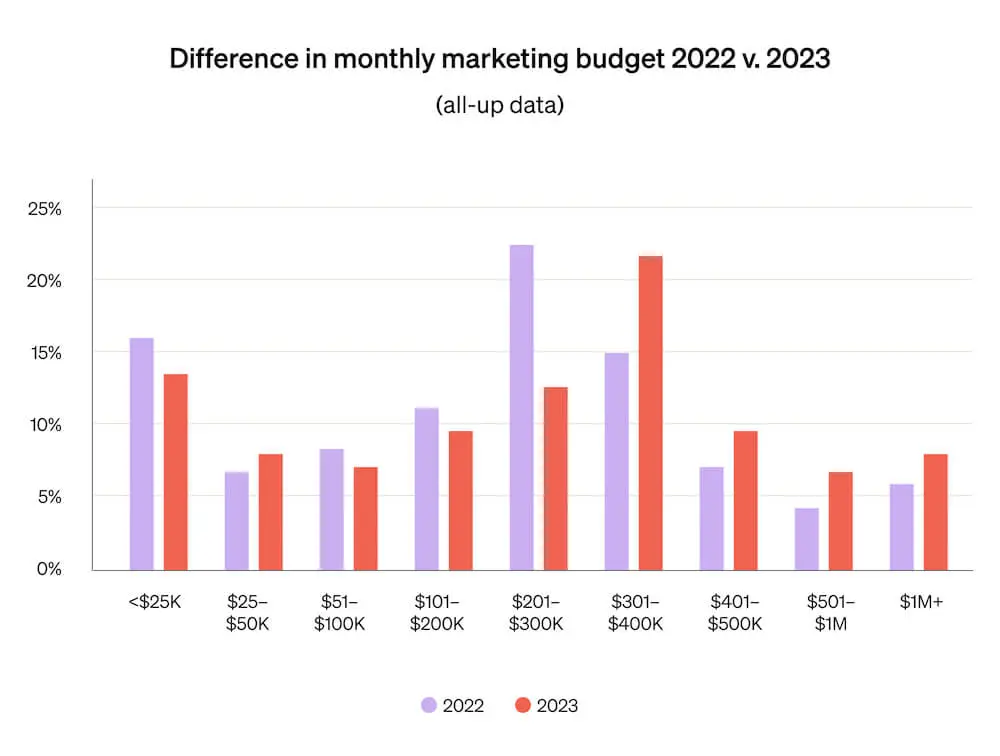
Broadly, larger marketing budgets will increase in 2023, while smaller marketing budgets will shrink. This may indicate that larger brands are reallocating budget and doubling down on the strategies they know drive profit, while smaller brands are trying not to spend money they don’t have.
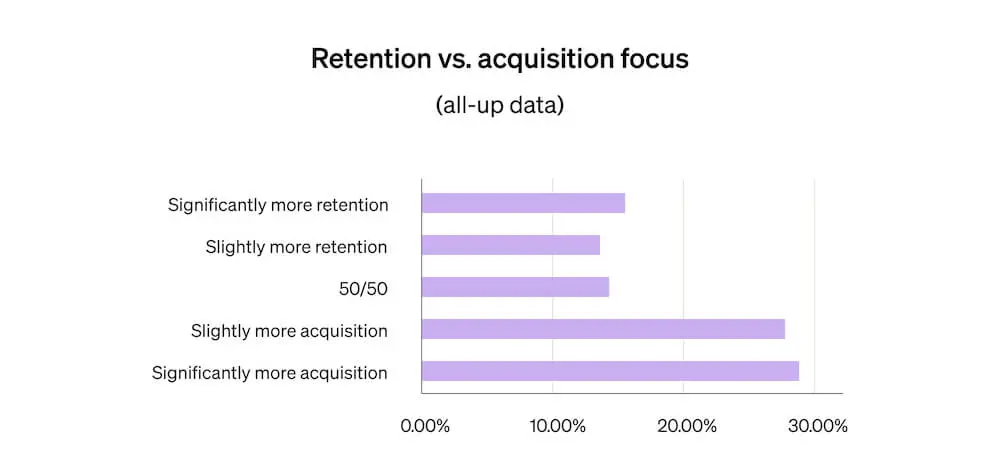
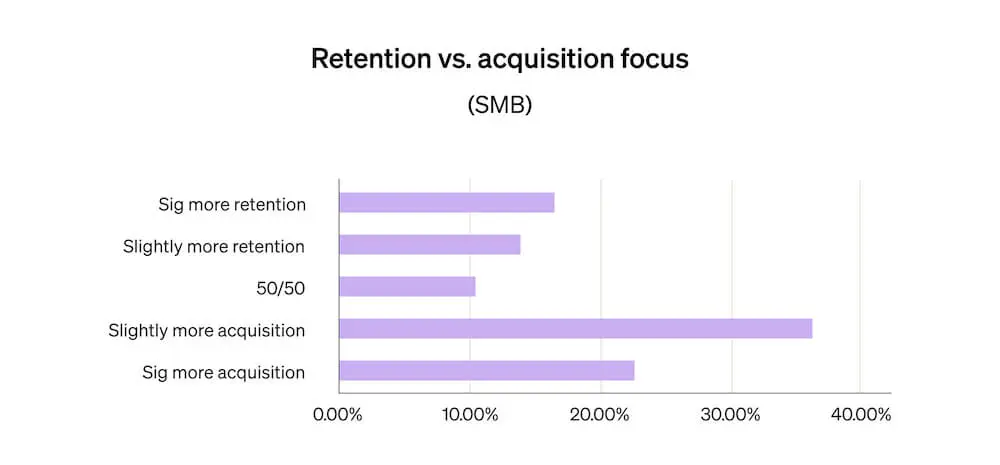
The trend could also be a response to rising customer acquisition costs. In 2023, the majority of ecommerce brands will invest more heavily in acquisition (55.75%) than retention (29.87%). Only 14.38% will invest equally.
The data suggests brands that can afford to meet heightened CACs will continue to invest in them—and reap the positive returns on their investment. Smaller businesses, meanwhile, will focus on getting scrappier with their dollars, potentially reallocating some of their spend to more affordable channels.
So, is retention the new acquisition? Not really. According to the data, marketers at businesses of all sizes understand you need both to run a successful marketing organization—although the exact balance varies slightly by business segment.
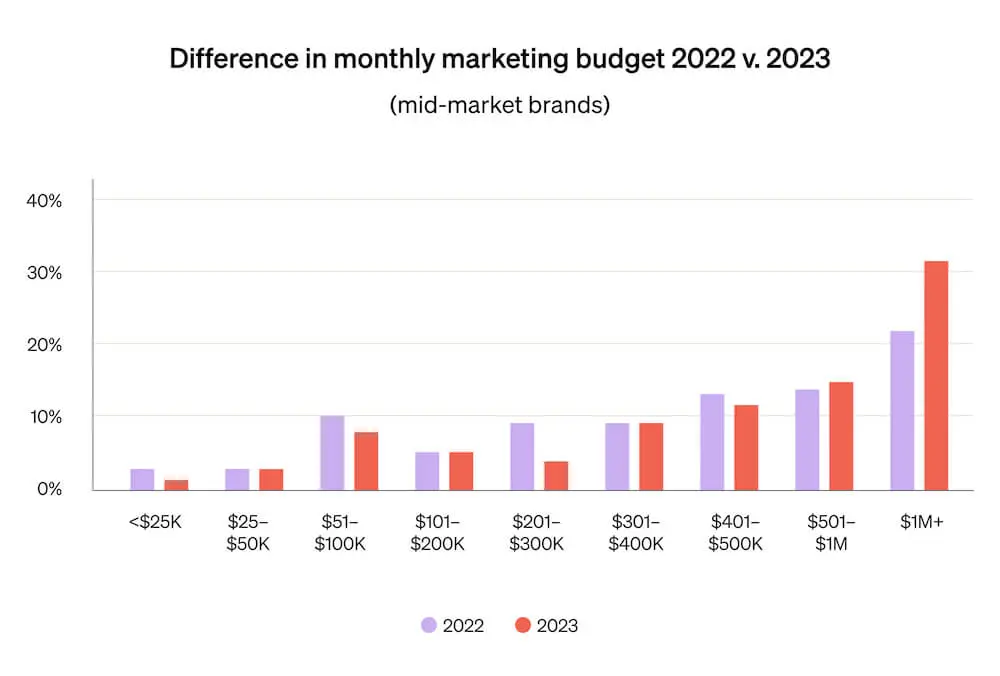
How mid-market marketing budgets will change in 2023
The highest percentage of mid-market brands (31.31%) will spend $1M+ per month on marketing in 2023—an increase of nearly 10% year over year in the number of businesses that plan to spend this much.
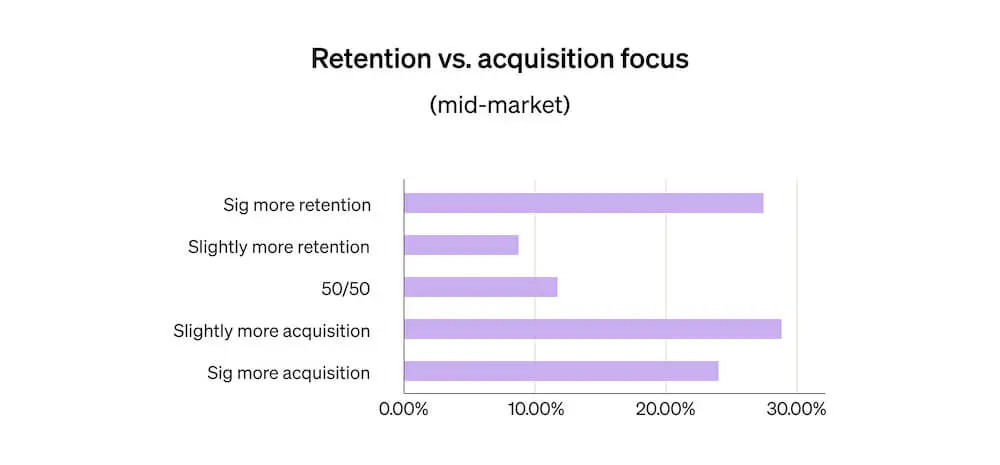
Mid-market is also the segment most likely to report a significant increase of marketing spend and focus on retention efforts (36.36%), side by side with acquisition efforts (52.52%). This is likely due to the need to offset acquisition costs and increase repeat purchase rate and lifetime value for the customers they acquire.
Additionally, since mid-market brands are larger and more established—and thus more likely to have earned stronger brand equity—they can afford to focus more of their efforts on retention, rather than generating awareness.
How SMB marketing budgets will change in 2023
Whereas mid-market businesses are most likely to spend $1M+ per month on marketing this year, SMBs are most likely (27.69%) to spend $301K-$400K—another nearly 10% increase YoY in the number of businesses that plan to spend this much.
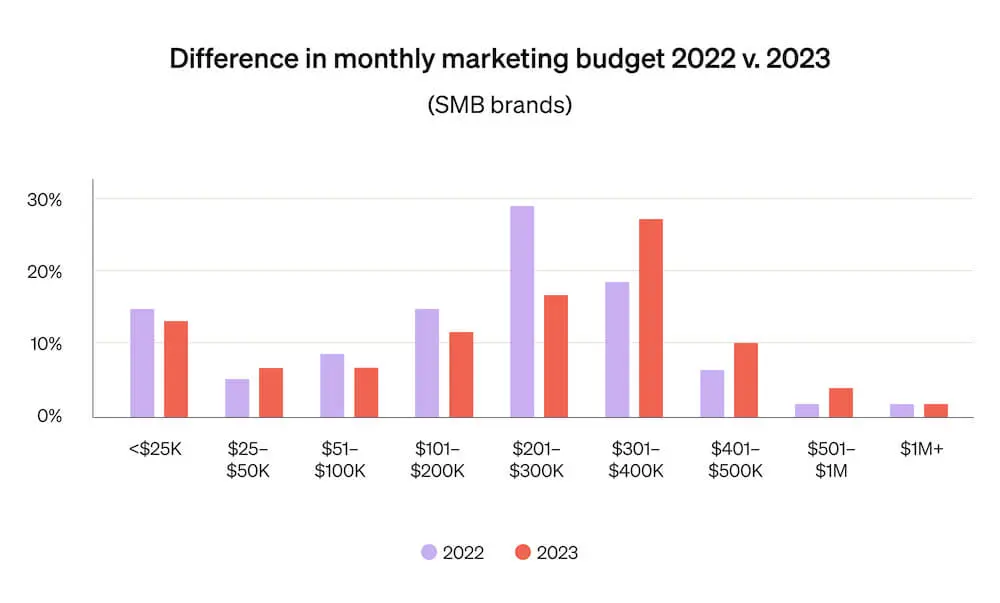
More than any other business segment, SMBs are investing more heavily in acquisition efforts (58.8%) than retention efforts (30.9%).
The ecommerce business marketing mix: all-up data
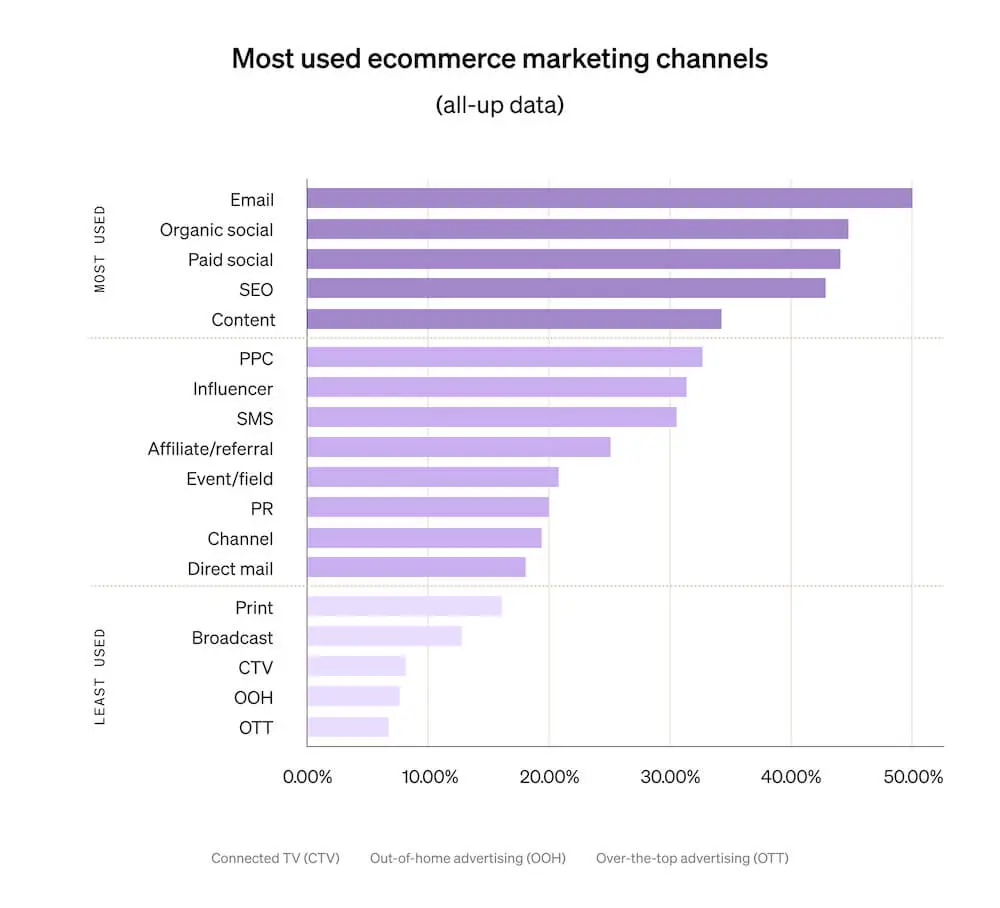
For all businesses, email reigns as the most-used ecommerce marketing channel: Exactly half (50%) of all businesses use email for marketing.
After that, organic social media, including TikTok, YouTube, Instagram, and Pinterest is most popular (44.88%), followed by paid social media advertising, including Facebook Ads and TikTok ads (44.42%); SEO (43.02%); and content marketing, including blogs, videos, and podcasts (34.65%).
The least 5 used marketing channels, by contrast, include the following:
- Print advertising: 16.51%
- Broadcast, including radio, film, and TV: 12.56%
- Connected TV (CTV): 7.67%
- Out-of-home advertising (OOH): 7.44%
- Over-the-top advertising (OTT): 6.74%
How much budget goes to each marketing channel?
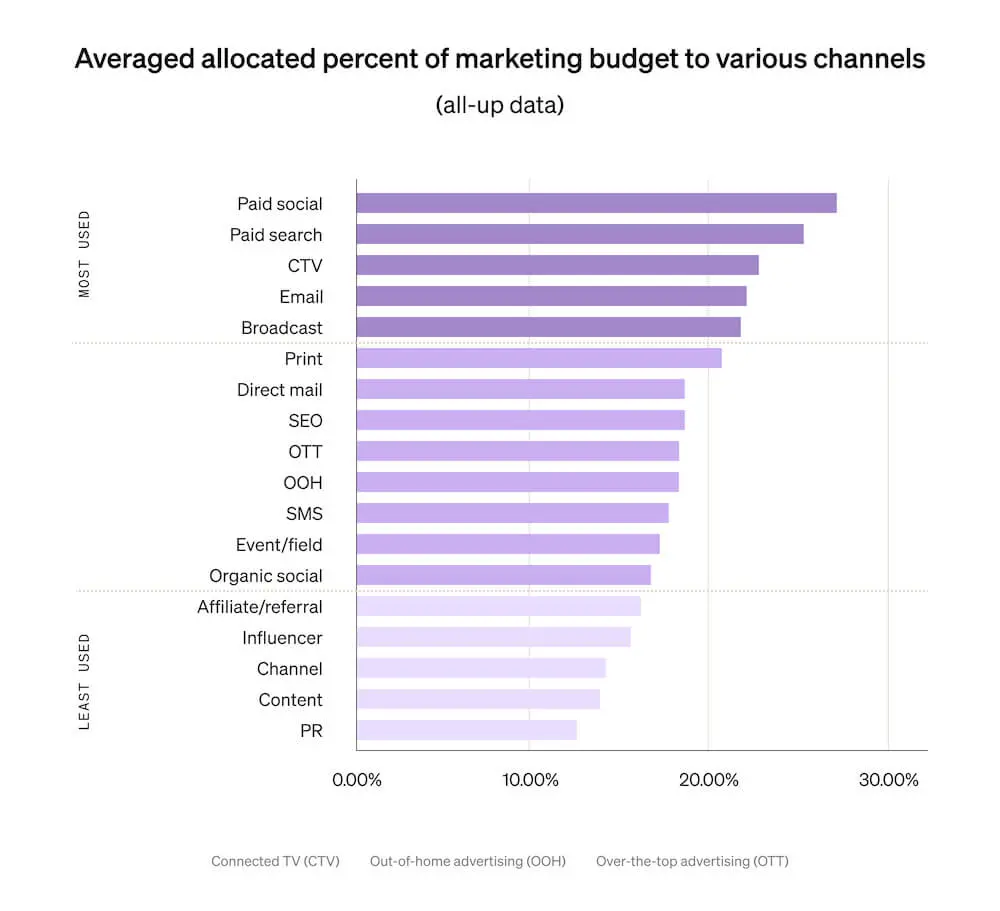
Marketing spend, however, shakes out a little differently. At the businesses that use them, the channels that demand the highest average portion of marketing budgets are paid social (26.66%) and paid search (25.61%), followed by CTV (23.06%), email marketing (22.57%), and broadcast (22.42%).
This could mean that these channels are higher priorities for the businesses that use them, or it could mean these channels cost more on average and therefore demand a greater portion of the budget.
The marketing channels with the least amount of marketing budget allocation at the businesses that use them, meanwhile, include:
- Affiliate and referral marketing: 16.24%
- Influencer marketing: 15.5%
- Channel marketing, including brand partnerships: 14.17%
- Content marketing: 14.02%
- Public relations (PR): 12.18%
Again, this could mean that these channels are lower priorities for businesses, or it could mean these channels are more cost-effective and therefore demand a lower portion of the budget.
Which marketing channels deliver the highest ROI?
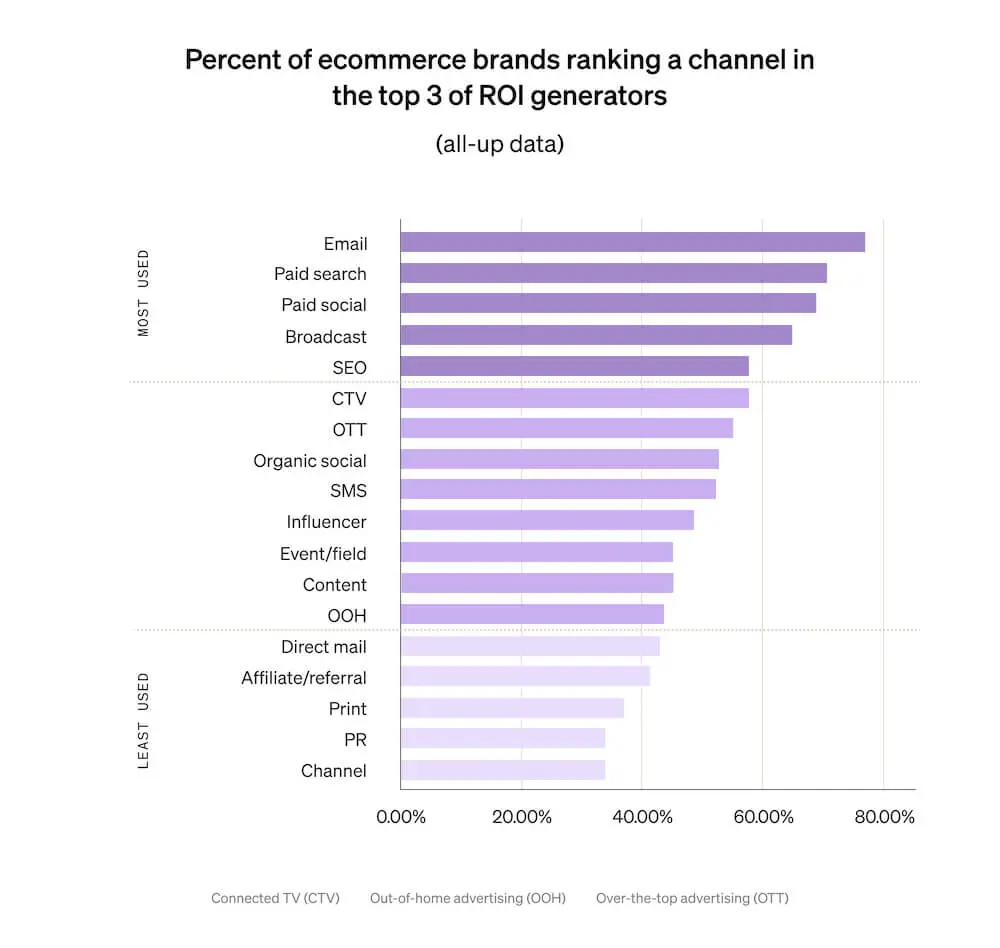
When ranking marketing channels by the ROI they deliver, email wins again: 76.86% of all businesses place email marketing in the top 3 ROI-generating marketing channels.
After email, top marketing channels for ROI include paid search (cited by 69.74% of brands as a top-3 ROI-generating channel), paid social (69.46%), broadcast (64.81%), and SEO (58.97%).
By contrast, brands are least likely to rank these 5 channels in the top 3 ROI generators:
- Direct mail: 41.58%
- Affiliate and referral marketing: 40.86%
- Print advertising: 38.16%
- PR: 34.09%
- Channel marketing: 34.07%
Remember that several of these—affiliate, PR, and channel marketing—also fall in the bottom 5 channels for budget allocation. Channels that don’t make money don’t get money.
The mid-market business marketing mix: SMS gains traction
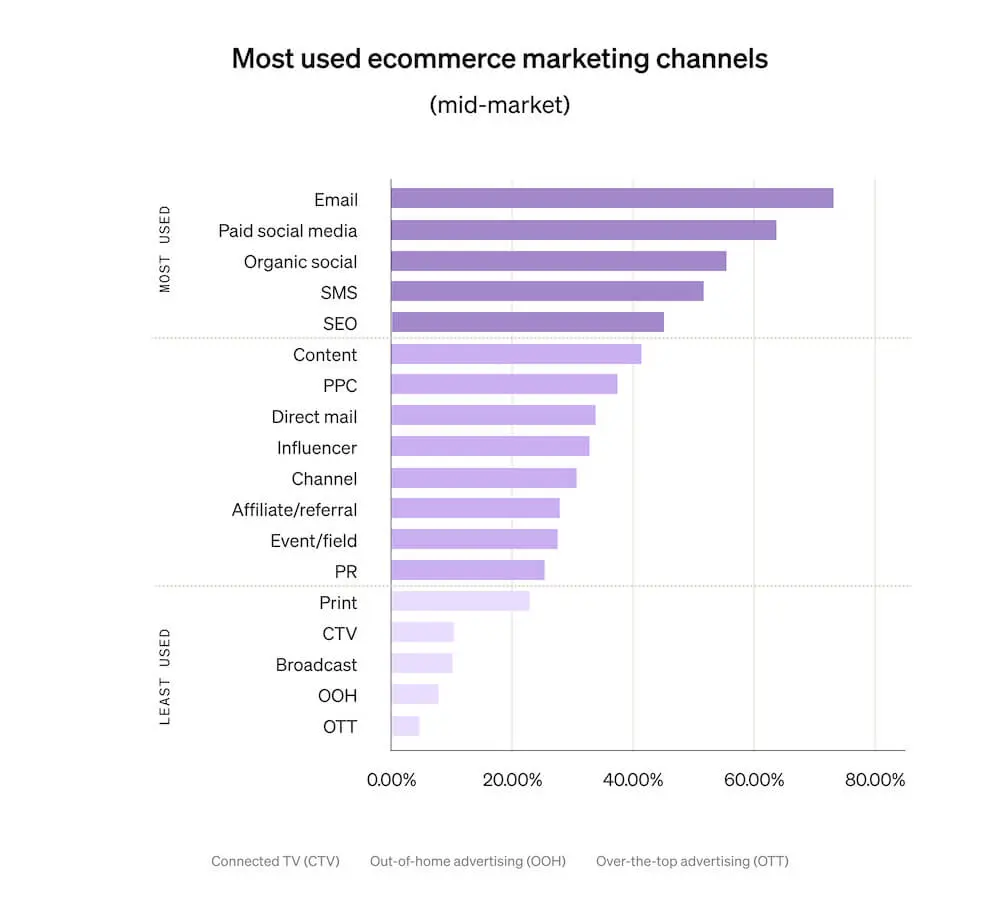
Email reigns supreme for mid-market businesses, too: An overwhelming majority (72.73%) of them use email as an ecommerce marketing channel—almost 1.5x the average.
After email, paid social is the most popular marketing channel among mid-market businesses (61.62%), followed by organic social (55.56%), SMS (51.52%), and SEO (46.46%). For the most part, these are the same channels that show up in the top 5 for businesses of all sizes, with one important exception: SMS.
Whereas only 30.47% of all businesses use SMS, over half of mid-market businesses do—suggesting SMS is gaining serious traction as a must-have marketing channel among leading brands.
SMS holds strong appeal. Like email marketing, it’s a channel where consumers must explicitly opt in to receive communications. Like email marketing, SMS marketing is an owned channel—meaning you, as the sender, have full control over your lists and distribution.
Also like email marketing, it works. David Morin, VP of client strategy at Narvar, points out that as mcommerce sales continue to increase year over year, “using SMS as a marketing channel can drive immediate search and sales.”
The least 5 used marketing channels among mid-market brands, meanwhile, include:
- Print advertising: 22.22%
- Broadcast + CTV: both 11.11%
- OOH: 9.09%
- OTT: 6.06%
Note that these are the same 5 channels that are the least used among businesses of all sizes—in the same order.
How much mid-market budget goes to which marketing channels?
Budget allocation shakes out similarly for mid-market businesses as it does for businesses of all sizes.
At the mid-market businesses that use them, the channels that demand the highest average portion of marketing budgets are paid search (24.79%) and paid social (23.31%). Email marketing (21.68%) and broadcast (18.7%) also fall into the top 5 channels mid-market businesses are investing their marketing dollars in.
Unlike businesses of all sizes, however, mid-market businesses that use the channel allocate a top-5 average of 19.44% of their marketing budget to SMS, compared to a 17.39% average across businesses of all sizes.
In other words, when they use SMS, businesses that make $20M+ in annual revenue invest nearly a fifth of their marketing budgets, on average, into the channel. That’s almost as much as they spend on paid search and paid social.
“More and more, it’s about meeting customers where they’re most likely, and willing, to engage,” Morin explains. “Especially as we head into a likely economic downturn, aligning a marketing mix that is hyper-targeted to meet consumer preferences is a better strategy for converting a higher rate of marketing dollars.”
Aligning a marketing mix that is hyper-targeted to meet consumer preferences is a better strategy for converting a higher rate of marketing dollars.
The marketing channels with the least amount of budget allocation at the mid-market businesses that use them, meanwhile, include:
- Channel marketing: 12.17%
- OTT: 11.00%
- Content marketing: 10.97%
- PR: 8.33%
- OOH: 6.33%
In the above list, OTT and OOH in the mid-market data replace affiliate and influencer marketing in the all-up data to round out the bottom 5 channels for mid-market budget allocation.

Which marketing channels deliver the highest ROI for mid-market brands?
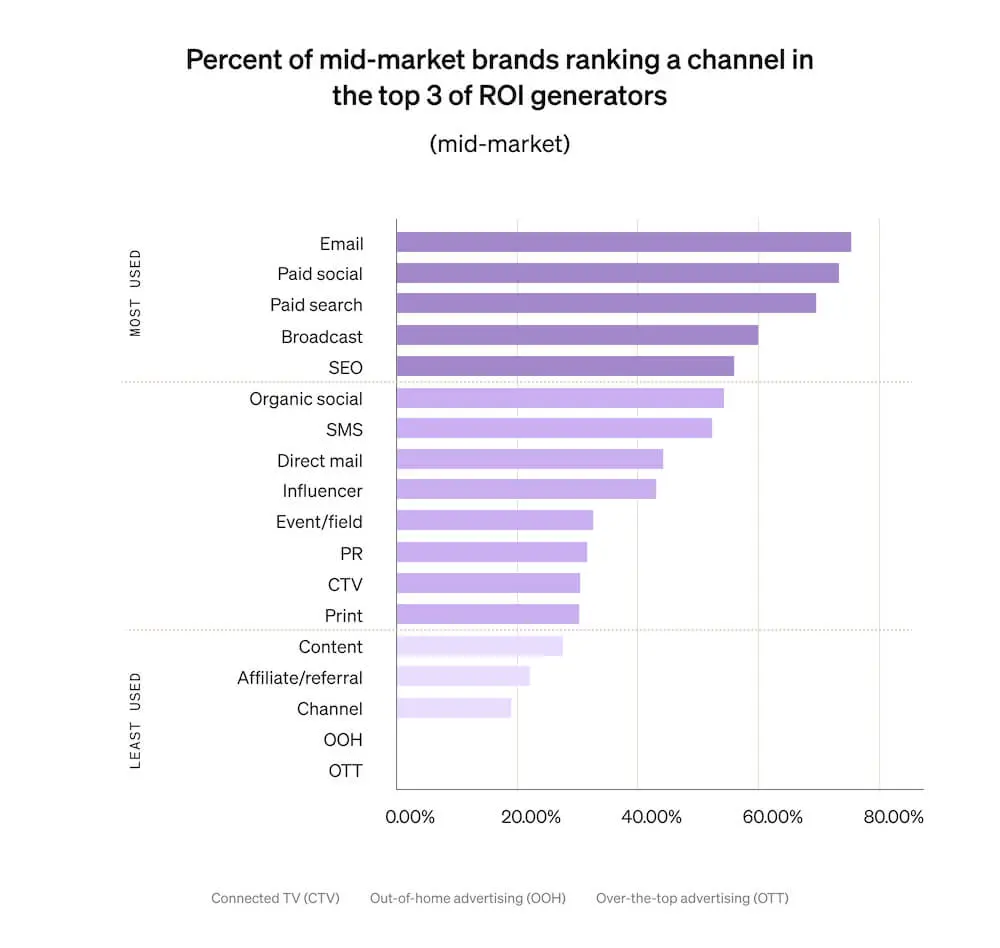
Almost as many mid-market businesses (73.77%) as businesses of all sizes (76.86%) place email marketing in the top 3 ROI-generating marketing channels. Again, that’s the highest percentage of any marketing channel.
After email, top marketing channels for mid-market ROI include paid social (cited by 72.55% of mid-market brands as a top-3 ROI-generating channel), paid search (70%), broadcast (60%), and SEO (56.76%).
Note that the top 5 ROI-generating channels are the same for mid-market businesses as they are for businesses of all sizes, in a slightly different order.
By contrast, mid-market brands are least likely to rank these 5 channels in the top 3 ROI generators:
- Content marketing: 28.14%
- Affiliate and referral marketing: 22.22%
- Channel marketing: 19.23%
- OOH: 0%
- OTT: 0%
In the above list, content marketing, OOH, and OTT in the mid-market data replace direct mail, print advertising, and PR in the all-up data to round out the bottom 5 channels for mid-market ROI generation.
The SMB marketing mix: personalized marketing delivers
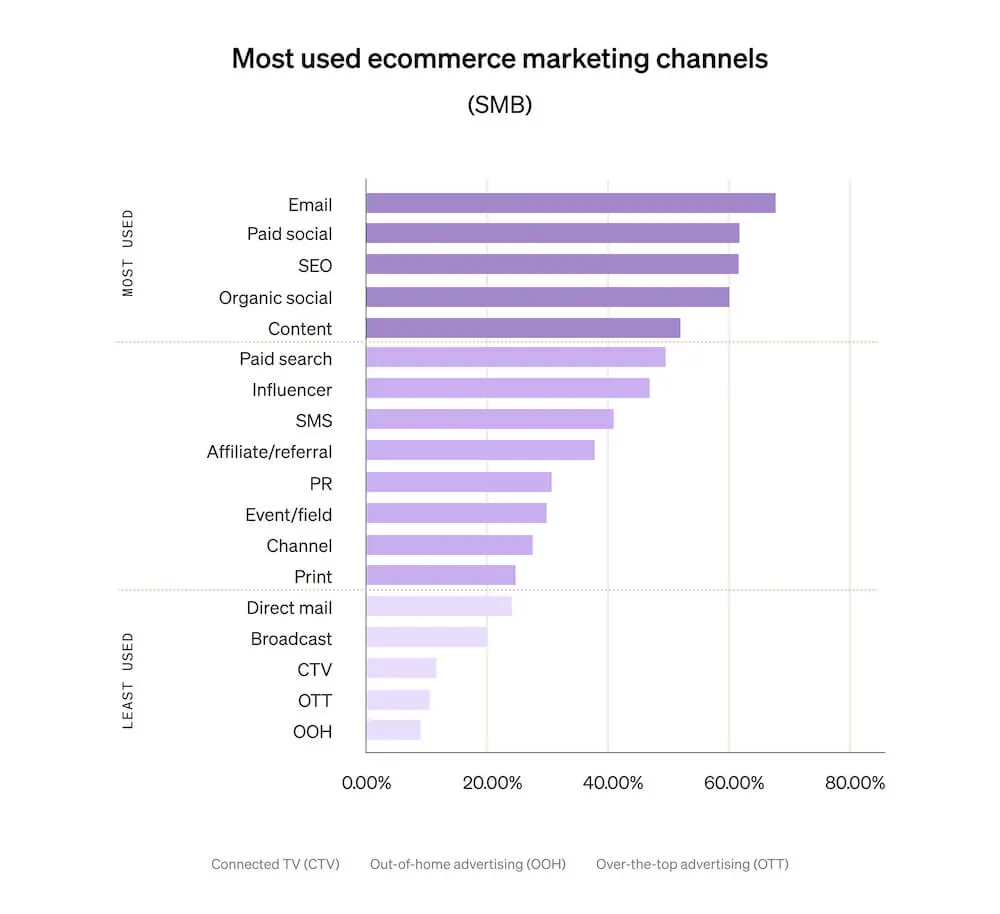
Although a lower percentage of SMBs (64.38%) than mid-market businesses (72.73%) use email as an ecommerce marketing channel, it’s still the most popular channel among this business segment.
After email comes paid social and SEO (tied at 60.52%), organic social (60.09%), and content marketing (50.64%). Note that these are the same channels that show up in the top 5 for businesses of all sizes, in a slightly different order.
The least 5 used marketing channels among SMBs, by contrast, include:
- Direct mail: 24.03%
- Broadcast: 20.17%
- CTV: 11.16%
- OTT: 10.73%
- OOH: 9.87%
In the above list, direct mail in the SMB data replaces print advertising in both the all-up and mid-market data to round out the bottom 5 marketing channels SMBs use. Otherwise, the channels that show up in this category are the same across the board.
How much SMB budget goes to each marketing channel?
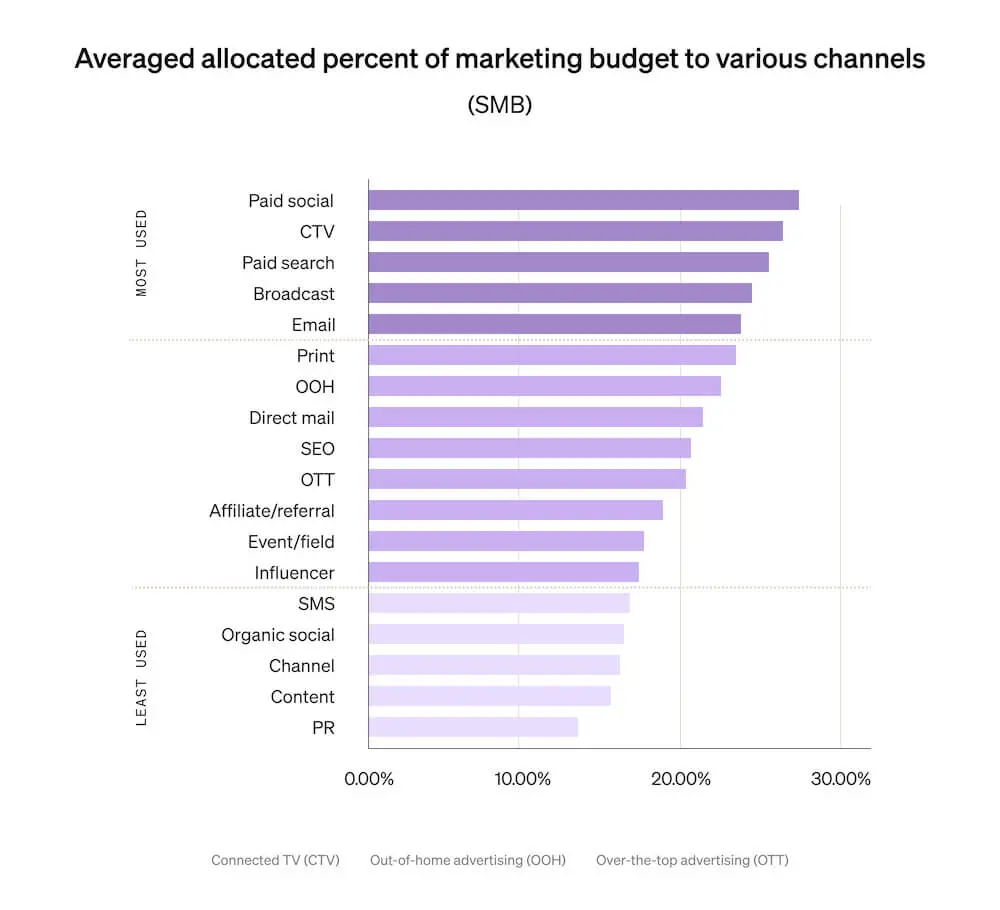
At the SMBs that use them, the channels that demand the highest average portion of marketing budgets are paid social (28.03%), CTV (27.25%), paid search (25.25%), broadcast (23.98%), and email marketing (23.55%). These are the same top 5 channels businesses of all sizes are investing their marketing dollars in, in a slightly different order.
Unlike mid-market businesses, however, which place SMS in the top 5 channels for marketing budget allocation, SMBs that use SMS place it in the bottom 5—signaling that the SMS marketing space may be less saturated, and therefore less competitive, for SMBs interested in exploring the channel.
The marketing channels with the least amount of budget allocation at the SMBs that use them include:
- SMS marketing: 17.24%
- Organic social: 17.00%
- Channel marketing: 16.17%
- Content marketing: 16.04%
- PR: 13.73%
Note that across business segments, channel marketing, content marketing, and PR consistently show up in the bottom 5 channels for marketing budget allocation.
Which marketing channels deliver the highest ROI for SMBs?
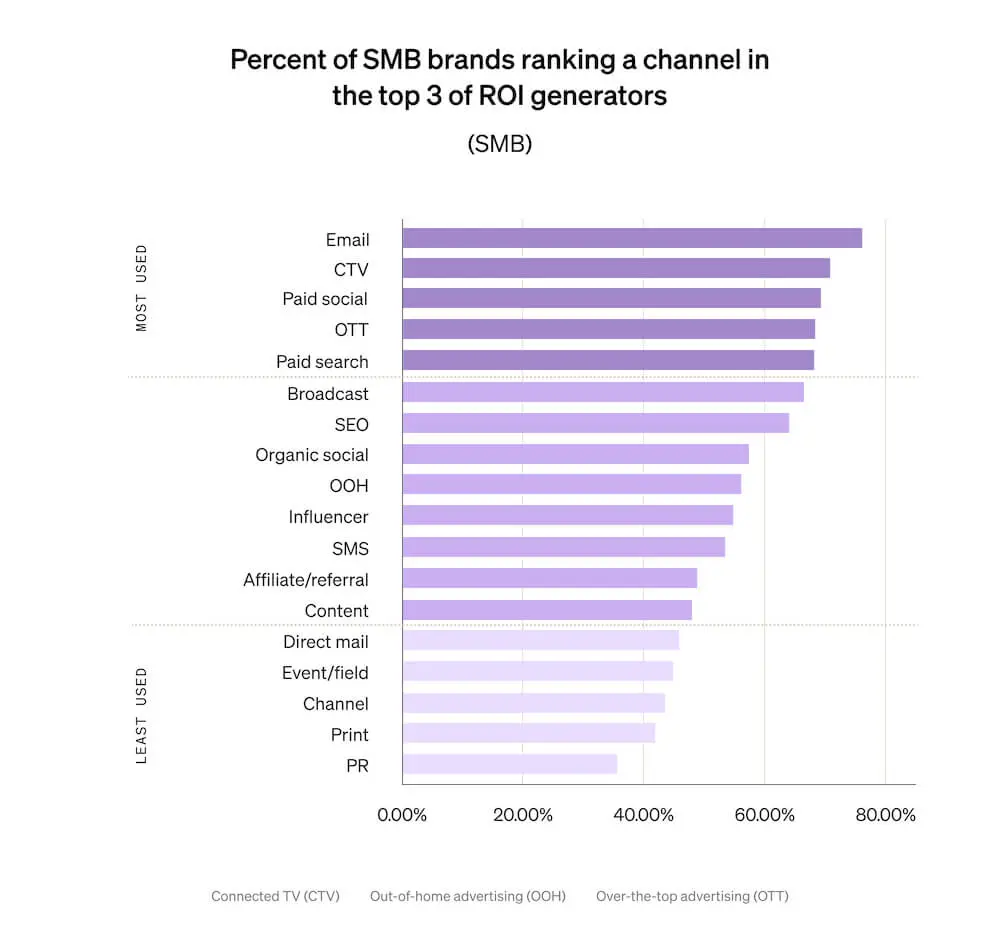
Even more SMBs (76.52%) than mid-market businesses (73.77%) place email marketing in the top 3 ROI-generating marketing channels. As is the case across business segments, that’s the highest percentage of any channel.
After email, though, top marketing channels for ROI shake out a bit differently for SMBs than for mid-market brands and businesses of all sizes.
Remember that, along with email, the top 5 ROI-generating channels for both mid-market brands and businesses of all sizes include paid social, paid search, broadcast, and SEO.
The top marketing channels for SMB ROI include paid social (cited by 69.6% of SMBs as a top-3 ROI-generating channel) and paid search (68%), too. But they also include CTV (70.84%) and OTT (68.19%).
What do email marketing, paid social, paid search, CTV, and OTT all have in common? They’re all ideal channels for not only tracking performance, but also delivering personalized experiences to prospects and customers.
Compared to traditional broadcast, especially, CTV and OTT offer far more precise tracking and targeting capabilities—which makes it more likely that the audience watching your ad will actually find it relevant and interesting. And the benefits of that kind of personalization are clear, given that SMBs identify all of these channels top ROI generators: more bang for your buck.
As SMBs continue to prioritize customer acquisition, “omnichannel personalization is a valuable area of focus they can leverage to hit their growth goals and continue to scale,” says John Erck, co-founder and CEO of Rebuy.
It’s a smart customer retention marketing strategy, too. “After the initial purchase, the consumer’s expectation of their experience with your brand dramatically increases,” Dollins points out. “Consumers want to receive personalized communications, experiences, and recommendations.”
The good news? “Consumers are willing to share their data to help facilitate this relationship and are even willing to pay more to purchase from brands with whom they have an established relationship,” Dollins says.
Consumers want to receive personalized communications, experiences, and recommendations.
Surfacing data-driven product recommendations, for example, “can prove to accelerate customer acquisition and retention benchmarks while also improving key metrics such as average order value, return on ad spend (ROAS), and revenue,” Erck says.
“Small teams move mountains and have less time to dedicate toward manual analysis, optimization, and testing,” adds Allen Finn, director of lifecycle marketing at Triple Whale. “With the rise of AI co-pilots, SMBs can supplement their efforts by letting machines do the heavy lifting, from creating new audiences to test to identifying where certain products get the best ROAS.”
SMBs are least likely, meanwhile, to rank these 5 channels in the top 3 ROI generators—all channels where performance is notoriously difficult to track:
- Direct mail: 46.94%
- Event or field marketing: 46.03%
- Channel marketing: 43.1%
- Print advertising: 42%
- PR: 36.07%
In the above list, event or field marketing in the SMB data replaces affiliate marketing in the all-up data to round out the bottom 5 channels for SMB ROI generation.
A deep dive into 5 top ecommerce marketing channels
Why these 5 channels? Because 4 of them are table stakes for brands—email, paid social, organic social, and SEO. And one of them—SMS—is quickly on the rise, especially among larger businesses.
1. Paid social
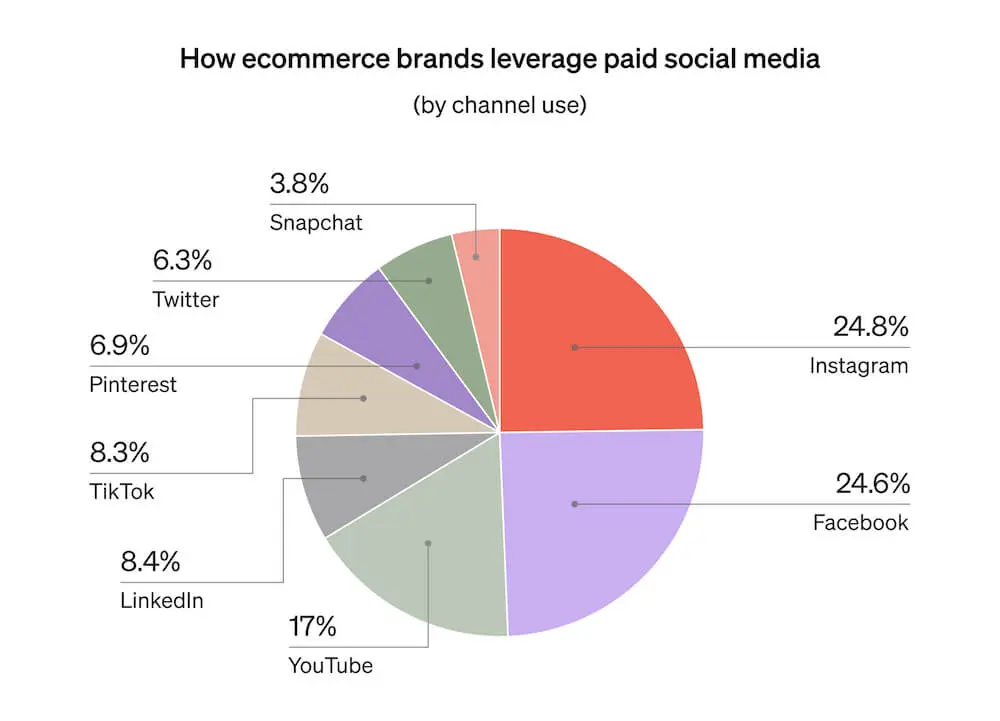
Of all the paid social channels, businesses of all sizes rely most heavily on Meta platforms: Instagram (24.77%) and Facebook (24.62%).
But video marketing is also hot: YouTube (16.97%) rounds out the top 3 paid social channels by usage.
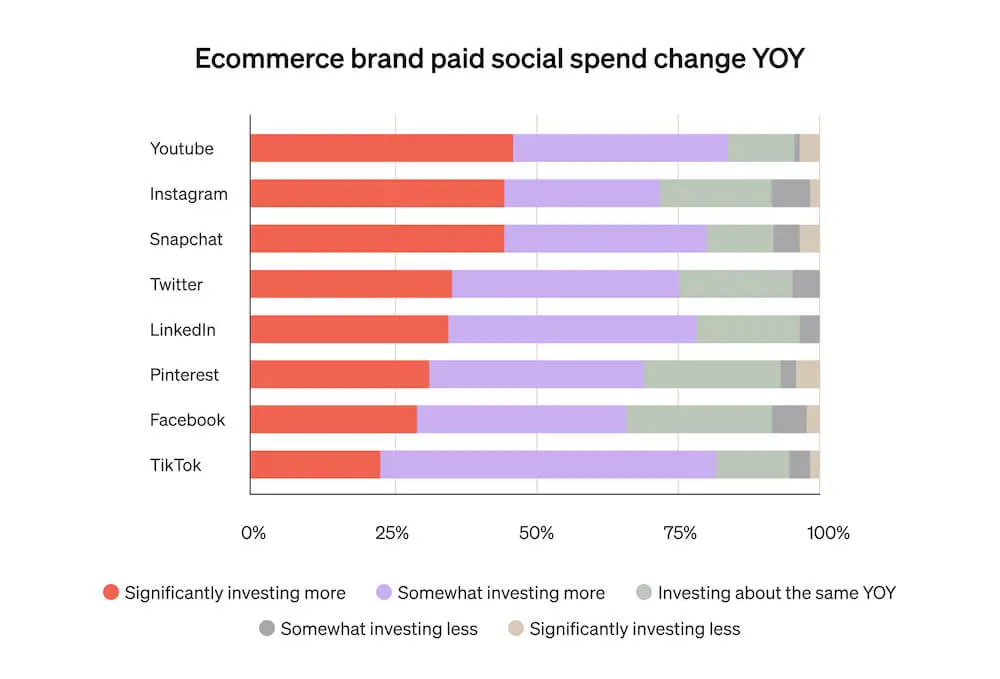
In 2023, marketers plan to invest “significantly more” of their paid social marketing dollars in:
- YouTube: 45.95%
- Instagram: 44.1%
- Snapchat: 44%
They plan to invest “somewhat more,” meanwhile, in:
- TikTok: 59.26%
- LinkedIn: 43.64%
- Twitter: 40%
From an ROI perspective, the highest proportion of ecommerce brands are “extremely satisfied” with the same paid social channels they use the most, with one notable exception—indicating their current strategies are, for the most part, paying off:
- YouTube: 49.55%
- Instagram: 43.83%
- Twitter: 36.59%
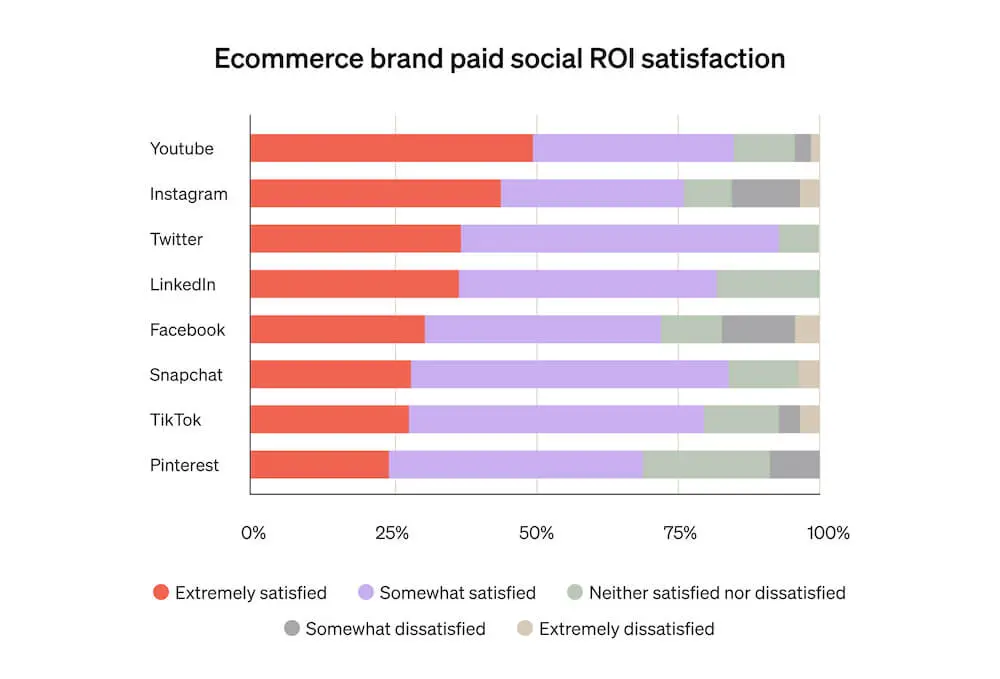
Although Facebook remains one of the most-used paid social channels, only 30.43% of ecommerce brands are “extremely satisfied” with their ROI from the platform.
In the aftermath of iOS 14.5, which made targeting and tracking on the platform more difficult, Facebook earns the highest percentage of “somewhat dissatisfied” responses (13.04%) and “extremely dissatisfied” responses (4.35%) of all other paid social channels.
How mid-market businesses are approaching paid social
Like businesses of all sizes, the paid social channels mid-market businesses use most heavily are Instagram (20.92%), Facebook (18.37%), and YouTube (17.86%).
Substantially more mid-market businesses (12.76%), however, are investing in LinkedIn than businesses of all sizes (8.41%) and SMBs (6.93%).
In 2023, mid-market businesses plan to invest “significantly more” of their paid social marketing dollars in:
- Instagram: 53.66%
- YouTube: 51.43%
- Twitter: 47.83%
They plan to invest “somewhat more,” meanwhile, in:
- Pinterest: 60%
- TikTok + Snapchat: both 57.14%
From an ROI perspective, the highest proportion of mid-market brands are “extremely satisfied” with almost the same paid social channels they use the most:
- Instagram: 56.1%
- LinkedIn: 52%
- YouTube: 40%
Although the majority of mid-market businesses plan to invest “somewhat more” in TikTok and Snapchat in 2023, the lowest percentage of them (21.43% and 14.29%, respectively) are “extremely satisfied” with the ROI these platforms deliver—and TikTok also earns the highest percentage of “extremely dissatisfied” responses (7.14%).
How SMBs are approaching paid social
The SMB paid social data aligns largely with the all-up data: The paid social channels SMBs use most heavily are Facebook (25.5%), Instagram (25.25%), and YouTube (17.08%).
In 2023, SMBs plan to invest “significantly more” of their paid social marketing dollars in:
- YouTube: 47.83%
- Instagram: 47.06%
- Snapchat: 44.44%
They plan to invest “somewhat more,” meanwhile, in:
- TikTok: 55.88%
- Twitter: 41.18%
- YouTube: 37.68%
From an ROI perspective, the highest proportion of SMBs are “extremely satisfied” with almost the same paid social channels they use the most:
- YouTube: 59.42%
- Instagram: 46.08%
- TikTok + Twitter: both 35.29%
But like businesses of all sizes, SMBs might be overinvesting in Facebook: Although it remains one of the most-used paid social channels among this business segment, only 33.01% of SMBs are “extremely satisfied” with their ROI from the platform—the lowest of any platform besides Pinterest (20.69%) and LinkedIn (25%).
2. Organic social
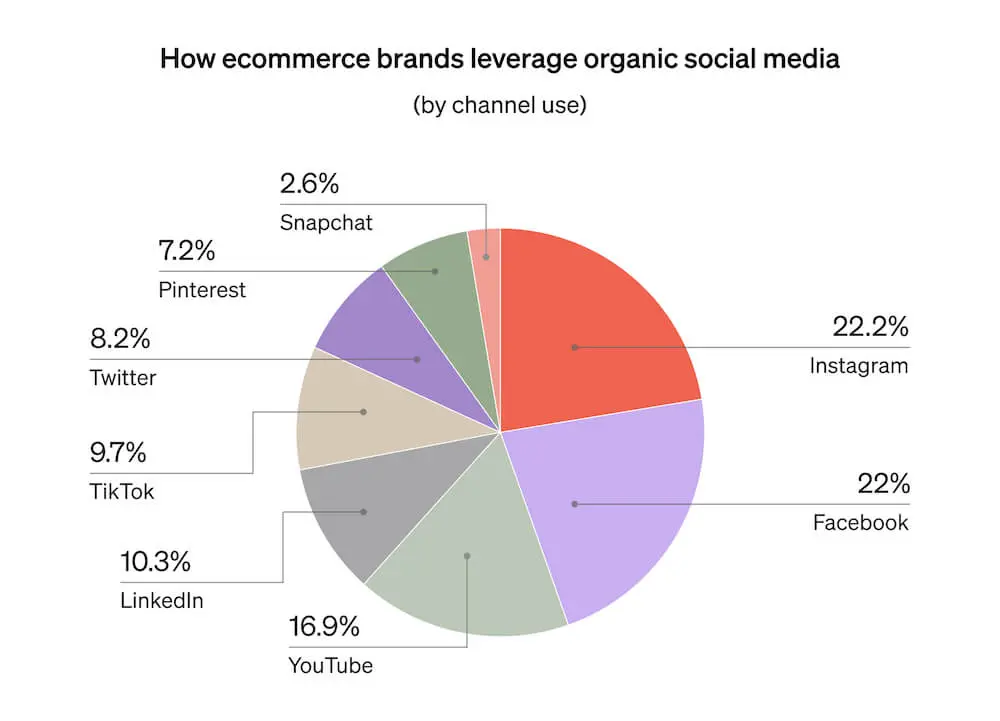
Organic social trends follow those of paid social: Once again, the most-used platforms across all business sizes include Instagram (22.17%), Facebook (22.03%), and YouTube (16.89%).
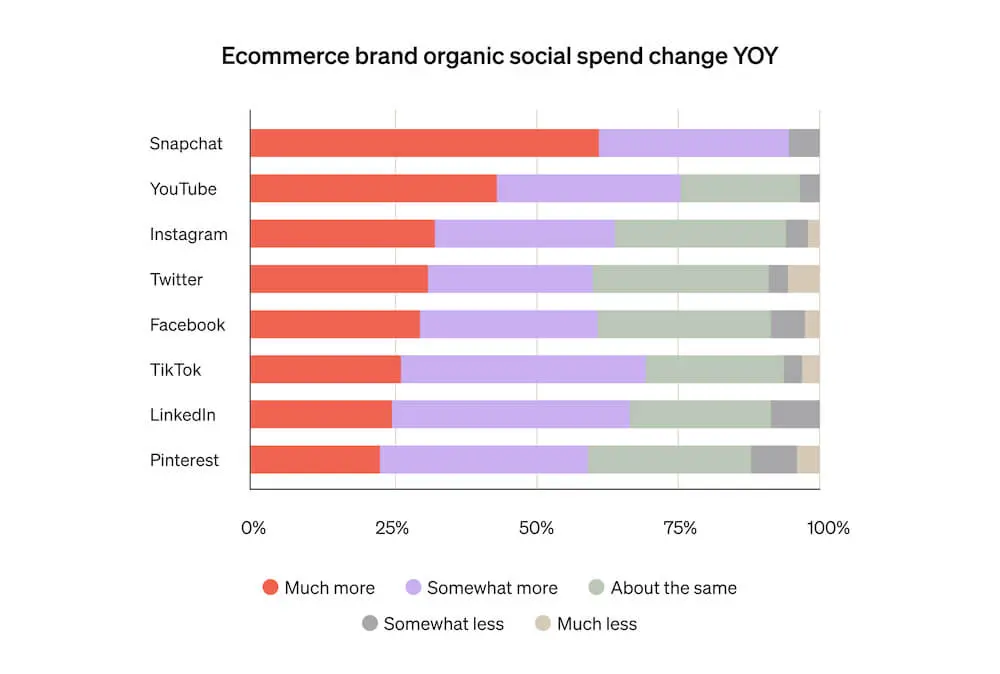
In 2023, marketers plan to invest “significantly more” of their organic social marketing dollars in:
- Snapchat: 61.11%
- YouTube: 42.98%
- Instagram: 32%
They also plan to experiment by investing “somewhat more” in:
- TikTok: 43.08%
- LinkedIn: 42.03%
- Pinterest: 36.73%
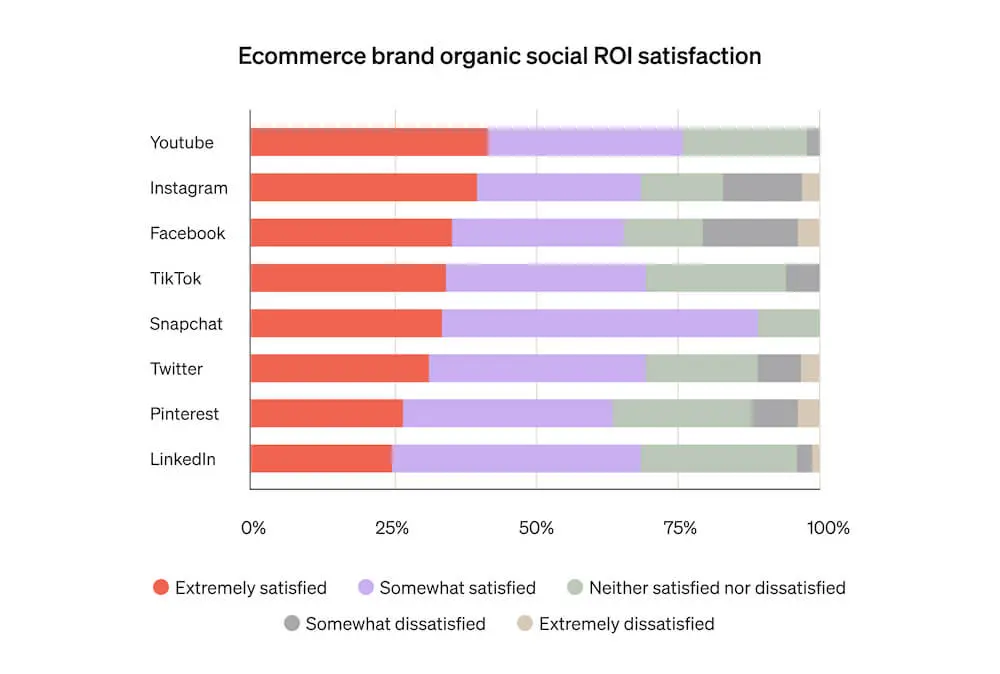
From an ROI perspective, the highest proportion of ecommerce brands are “extremely satisfied” with exactly the same organic social channels they use the most, in a slightly different order:
- YouTube: 41.23%
- Instagram: 39.33%
- Facebook: 34.9%
How mid-market businesses are approaching organic social
Like businesses of all sizes, the organic social channels mid-market businesses use most heavily are Instagram (20.5%), Facebook (20.5%), and YouTube (18.63%). Those numbers are slightly lower than average for Instagram and Facebook, but slightly higher for YouTube.
Again, more mid-market businesses (14.91%) are investing in organic social on LinkedIn than businesses of all sizes (10.28%) and SMBs (9.22%).
In 2023, mid-market businesses plan to invest “significantly more” of their organic social marketing dollars in:
- YouTube: 58.62%
- Instagram: 53.13%
- Twitter: 46.67%
They plan to invest “somewhat more,” meanwhile, in:
- Pinterest: 57.14%
- LinkedIn: 47.83%
- TikTok: 41.67%
From an ROI perspective, the highest proportion of mid-market brands are “extremely satisfied” with almost the same organic social channels they use the most:
- YouTube: 62.07%
- Instagram: 56.25%
- TikTok: 50%
Despite the mid-market segment’s heavier focus on LinkedIn advertising, however, only 21.74% of respondents are “extremely satisfied” with their ROI on the platform—the lowest of any.
How SMBs are approaching organic social
Again, the SMB organic social data aligns largely with the all-up data: The organic social channels SMBs use most heavily are Facebook (21.43%), Instagram (21.43%), and YouTube (17.97%).
In 2023, SMBs plan to invest “significantly more” of their organic social marketing dollars in:
- Snapchat: 69.23%
- YouTube: 39.74%
- Instagram: 33.33%
They plan to invest “somewhat more,” meanwhile, in:
- LinkedIn: 40%
- TikTok: 39.53%
- YouTube: 35.9%
From an ROI perspective, the highest proportion of SMBs are “extremely satisfied” with almost the same organic social channels they use the most:
- Instagram: 41.94%
- Facebook: 39.78%
- Snapchat: 38.46%
Although Instagram earns the highest proportion of “extremely satisfied” responses in this category, it also earns the highest proportion of “somewhat dissatisfied” responses (16.13%)—suggesting organic Instagram marketing works, but not for everyone.
“The rise of social shopping presents a huge opportunity for SMBs to revamp their marketing mix in 2023,” says Oren Inditzky, VP of online stores at Wix. With a projected $2T market by 2025, “social media platforms like Instagram, Facebook, and TikTok offer seamless integration options for businesses to showcase their products, engage with customers, and drive sales.”
Considering 73% of US consumers engage with multiple channels during their purchasing journey, “SMBs should adopt an omnichannel approach to expand their reach and customer acquisition opportunities,” Inditzky suggests. “An omnichannel strategy fosters a cohesive brand experience and a seamless shopping journey, while significantly enhancing the potential for acquiring new customers.”
3. SEO
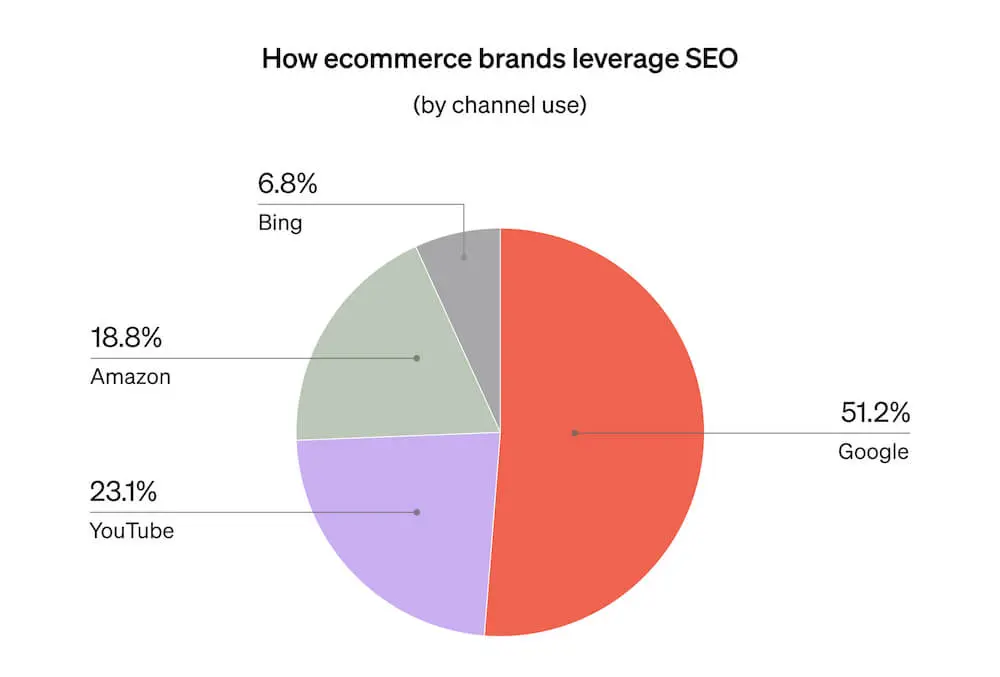
For SEO, businesses of all sizes rely most heavily on Google (51.23%). But YouTube (23.15%) narrowly beats out Amazon (18.83%) for second place—indicating that marketers are paying close attention to both video marketing and their omnichannel marketing strategies.
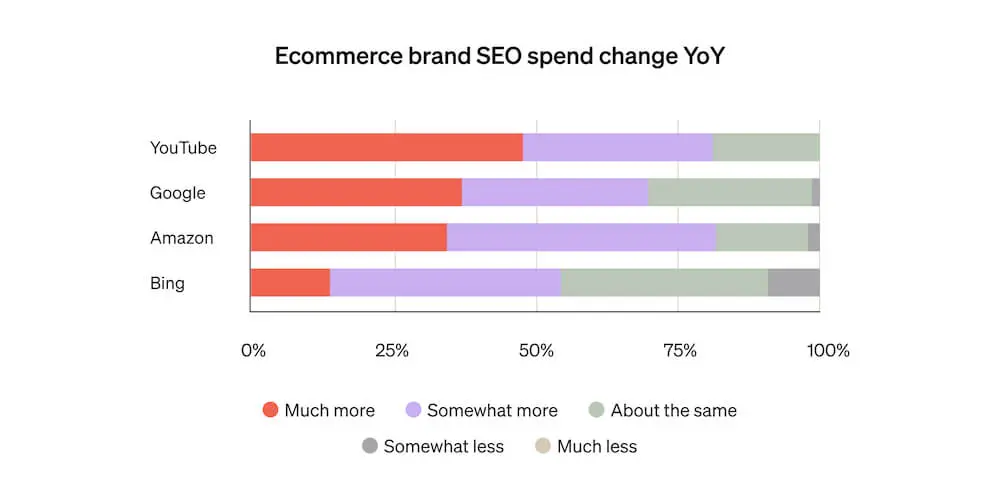
In 2023, marketers plan to invest “significantly more” of their SEO marketing dollars in:
- YouTube: 48%
- Google: 37.35%
- Amazon: 34.43%
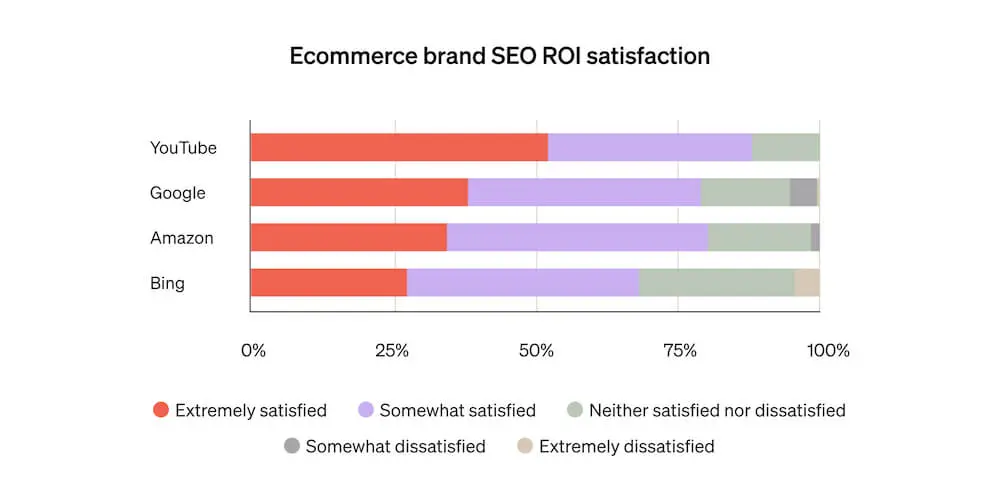
From an ROI perspective, the highest proportion of ecommerce brands are “extremely satisfied” with YouTube (52%)—while the highest proportion (4.82%) are “somewhat dissatisfied” with Google. Zero survey respondents indicated any level of dissatisfaction with ROI on YouTube for SEO.
How mid-market businesses are approaching SEO
Like businesses of all sizes, the search engine channels mid-market businesses use most heavily are Google (57.14%), YouTube (25.4%), and Amazon (14.29%). That’s higher than average for Google, about even for YouTube, and lower than average for Amazon.
In 2023, mid-market businesses plan to invest “significantly more” of their SEO marketing dollars in:
- Google: 50%
- YouTube: 50%
- Amazon: 33.33%
From an ROI perspective, the highest proportion of mid-market brands are “extremely satisfied” with YouTube (50%), followed by Google (41.67%). But Google is also the only SEO channel with which mid-market brands indicate any level of dissatisfaction in terms of ROI (“somewhat dissatisfied” at 5.56%).
How SMBs are approaching SEO
No surprises in the SMB SEO data: Like all other businesses, SMBs rely most heavily on Google (49.34%), YouTube (24.67%), and Amazon (18.5%).
In 2023, SMBs plan to invest “significantly more” of their SEO marketing dollars in:
- YouTube: 50%
- Google: 39.29%
- Amazon: 38.1%
From an ROI perspective, the highest proportion of SMBs are “extremely satisfied” with YouTube (55.36%), followed by Google (41.07%). Bing earns the highest proportion of “extremely dissatisfied” responses at 5.88%.
4. Email marketing
Marketers are leveraging a healthy mix of email marketing strategies, including automation (27.55%), campaigns (26.65%), personalization (23.08%), and segmentation (22.72%)—almost an even split across the board.

In 2023, the highest proportion (33.12%) of marketers plan to invest “significantly more” in email automation. This indicates that automation is a high-performing, but possibly lower-adoption, method over campaigns, for example—where only 20.81% of marketers plan to invest “significantly more” in 2023.

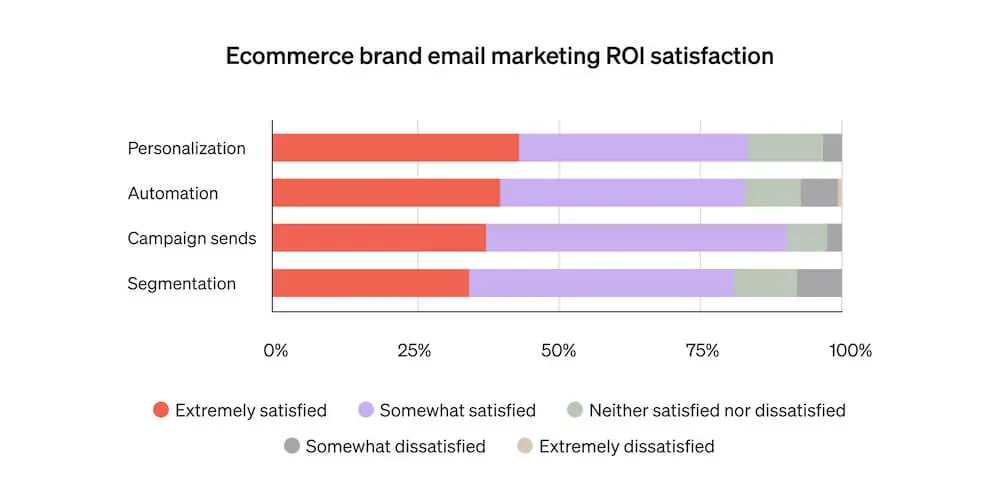
From an ROI perspective, the highest proportion of ecommerce brands (43.41%) are “extremely satisfied” with personalization.
How mid-market businesses are approaching email marketing
Like businesses of all sizes, mid-market businesses are splitting their email marketing strategy fairly evenly between automation (27.54%), campaigns (26.81%), personalization (26.09%), and segmentation (19.57%).
In 2023, the highest proportion (47.22%) of mid-market businesses plan to invest “significantly more” in personalization—more than 1.5x the average (28.68%).
From an ROI perspective, the highest proportion of mid-market brands are “extremely satisfied” with personalization (58.33%), followed by campaigns (45.95%). Zero mid-market respondents report that they are “extremely dissatisfied” with the ROI on email marketing strategies of any kind.
How SMBs are approaching email marketing
Like all other business segments, SMBs are splitting their email marketing strategies fairly evenly between automation (26.95%), campaigns (25.75%), segmentation (23.35%), and personalization (23.05%).
In 2023, the highest proportion (37.78%) of SMBs plan to invest “significantly more” in automation—slightly higher than the average (33.12%), but lower than the proportion of mid-market businesses that plan to do the same (42.11%).
From an ROI perspective, the highest proportion (44.44%) of SMBs are “extremely satisfied” with automation, followed by personalization (40.26%).
5. SMS marketing
Over half (52.13%) of ecommerce businesses that use SMS use it for marketing, while 24.17% use transactional SMS and 23.70% use conversational SMS.

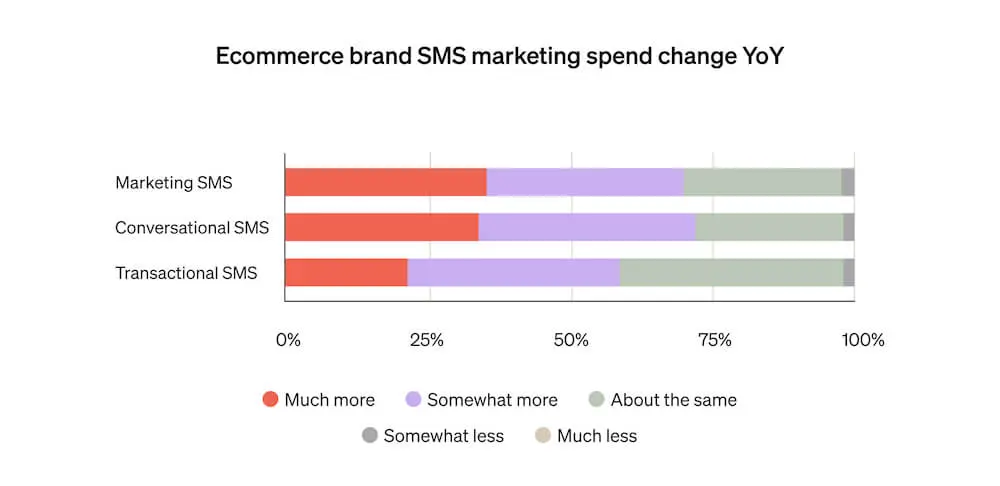
That leaves plenty of opportunity for businesses to experiment more with non-marketing SMS communications this year—and it looks like they plan to. In 2023, the highest proportion (35.45%) of marketers plan to invest “significantly more” in SMS marketing—and 34% also plan to invest this much in conversational SMS.
From an ROI perspective, a substantial proportion of ecommerce brands are “extremely satisfied” with all kinds of SMS:
- Conversational: 46%
- Transactional: 39.22%
- Marketing: 36.36%
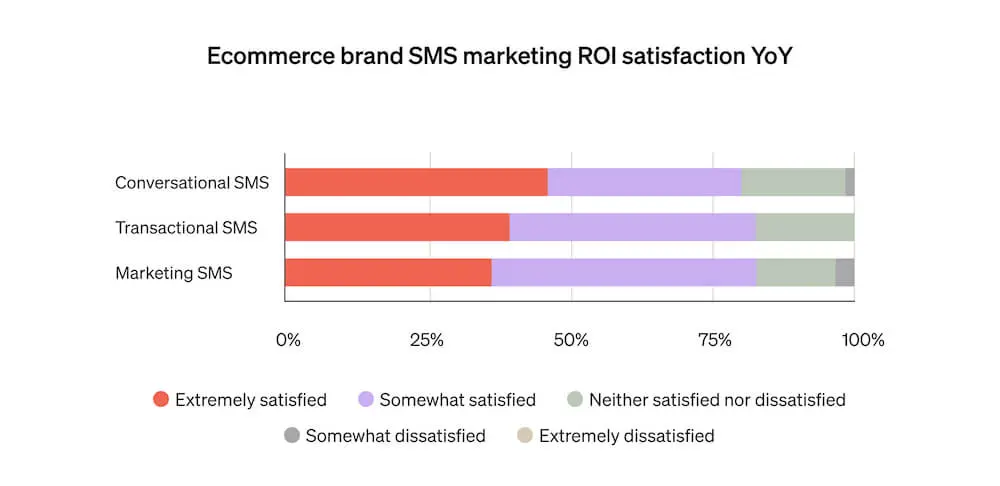
Zero respondents report that they are “extremely dissatisfied” with the ROI on SMS marketing strategies of any kind.
How mid-market businesses are approaching SMS marketing
Like businesses of all sizes, more than half (54.84%) of mid-market businesses are using SMS for marketing, followed by conversational SMS (25.81%) and transactional SMS (19.35%).
But whereas businesses of all sizes are more likely to invest “significantly more” in SMS marketing (35.45%) than conversational SMS (34%), mid-market businesses are more likely to invest “significantly more” in conversational SMS (50%) than SMS marketing (41.18%).
Only 16.67% of mid-market businesses plan to invest “significantly more” in transactional SMS in 2023—lower than the average of 21.57%.
From an ROI perspective, a substantial proportion of mid-market brands are “extremely satisfied” with all kinds of SMS:
- Marketing: 50%
- Transactional: 41.67%
- Conversational: 37.5%
How SMBs are approaching SMS marketing
SMBs are using SMS marketing at a rate slightly lower than average (47.73%). But they’re more likely than mid-market businesses to use transactional SMS (27.27% of them, compared to only 19.35% of mid-market businesses). About the same proportion of SMBs (23.48%) use conversational SMS as mid-market businesses (25.81%).
In 2023, SMBs plan to invest “significantly more” in SMS marketing (36.51%), as well as conversational SMS (29.03%) and transactional SMS (25%).
From an ROI perspective, a substantial proportion of SMBs are “extremely satisfied” with all kinds of SMS:
- Conversational: 51.61%
- Transactional: 38.89%
- Marketing: 33.33%
What SMBs can learn from mid-market brands—and vice versa
This year, businesses that make $20M+ in annual revenue are planning the most significant increase of marketing spend and focus on retention efforts, side by side with acquisition efforts—perhaps because they recognize that a strong retention marketing strategy can, in turn, make acquisition marketing more profitable.
SMBs, which plan to focus substantially more of their marketing resources on customer acquisition, might want to take note. “As the world heads further into economic uncertainty, it’s critical that emerging brands shift resources not only to acquisition, but also to retention,” Dollins emphasizes.
As the world heads further into economic uncertainty, it’s critical that emerging brands shift resources not only to acquisition, but also to retention.
Consider SMS marketing, for example, which mid-market brands are already investing in heavily: At a time when consumer attention is low and paid ads are becoming more expensive and less effective, SMS marketing is a prime retention play—an opportunity for businesses of all sizes to turn one-time transactions into lifelong relationships with loyal customers.
The SMS marketing space may be less crowded, and therefore less competitive, for SMBs interested in exploring the channel. And that’s good news, considering SMBs are already successfully differentiating themselves from larger, more established brands by investing in channels where they can make the customer experience more personalized.
According to research from Epsilon, 80% of consumers are more likely to make a purchase when a brand offers a personalized experience. “As ecommerce brands build a larger customer base, attention typically shifts to customer retention and creating a longer lifetime value—both of which can be improved with a solid personalization strategy,” Erck explains.
As ecommerce brands build a larger customer base, attention typically shifts to customer retention and creating a longer lifetime value—both of which can be improved with a solid personalization strategy.
Moving forward, “mid-market brands will need to adapt to the communication preferences of today’s consumers who crave personalized and convenient experiences,” Dollins agrees.
Remember that, of all email marketing strategies, ecommerce brands of all sizes are most satisfied with their ROI on personalization efforts. And like email, SMS is a channel where customer data goes a long way: Marketers can use segmentation and automation to deliver highly relevant, personalized text messages to the people who are most likely to act on them.
“By investing in more intimate channels like SMS,” Dollins says, “brands can create a more engaging and convenient customer experience that facilitates repeat purchases and fosters brand loyalty.”
Owned marketing hasn’t always had the sexiest reputation. Compared to paid and performance marketing, which have spent the better part of a decade seducing revenue-hungry businesses with third-party targeting and long marketing attribution windows, owned marketing has sometimes been accused of being old-fashioned, tone-deaf—even dead.
And based on the data, paid channels are clearly still top of mind for ecommerce marketers. But in an economically challenged, post-iOS 14.5 world, when paid targeting is getting less precise and consumers are getting more selective about which brands they deem worthy of their money, building strong relationships with loyal customers now depends on your ability to communicate with them in a way that makes them feel seen, heard, and valued.
Your email and SMS lists—as well as how you collect, organize, and use your customer data—are where that work begins.
They’re also where top brands like yours will continue to invest their dollars.

Related content
Achieve more in 3 months with Klaviyo Marketing Analytics. This calendar gives you the structure and documentation you need to level up.

Discover 6 data-driven ways to use Klaviyo Marketing Analytics to boost BFCM performance, personalize campaigns, and drive long-term customer retention.
Use this quick customer lifetime value formula to understand your business health and customer experience.