Your guide to ecommerce analytics and performance optimization
“The devil is in the detail” should really be “The devil is in the data.”
Data is the bedrock of every ecommerce business. Without it, you’re fumbling around in the dark. You don’t know for sure who your customers are, what products they like, or how much they spend.
But having access to all this data can be both a blessing and a curse. A blessing, because obviously you want to know what’s working and what’s not. A curse, because it can be useless if you don’t know what to do with it.
This is where ecommerce analytics comes into play. They help you understand the why behind the what so you can make smarter decisions moving forward.
Here, we’ll break down what ecommerce analytics actually is, why they’re incredibly useful, and how you can use a dedicated analytics platform to drill down beyond the basics.
What is ecommerce analytics?
Ecommerce analytics is how you collect, analyse, and act on data about your online store. It’s everything from knowing how many people visited your site last week to understanding which products are most likely to convert first-time buyers into repeat customers.
The main role of ecommerce analytics is to help you figure out what’s working, what’s not, and, most importantly, what to do next.
7 benefits of an ecommerce analytics platform
One of the biggest myths about analytics is that they’re all about numbers. And, sure, numbers play a major role. But it’s more about understanding your customers, your business, and where you’re headed. The numbers are merely your pathway in.
Here are some common benefits of ecommerce analytics—and, more specifically, the benefits of having a platform that tracks, reports, and uncovers all the juicy data.
1. Know your customers on a deeper level
While it’s handy knowing how many people visited your store or clicked on an email, it doesn’t give you the full picture. You need to understand who they are, what they want, and how they behave.
Detailed ecommerce analytics (and a dedicated platform) helps you segment your audience based on their shopping behavior, spending habits, and interests, as well as track customer journeys and identify patterns.
As a result, you can make completely unique, personalized journeys for each and every customer, triggered by their previous actions.
2. Cut the guesswork out of decision-making
Making decisions based on a gut feeling is all too common. It might work in the short term, but you can’t rely on instinct when dealing with hundreds of thousands in revenue and serving a high volume of customers.
An ecommerce analytics platform brings all your data together to help you make informed decisions that are rooted in reality, not an inkling you had during your morning walk—whether it’s optimising your marketing spend or choosing which products to promote.
3. Turn insights into action, fast
Basic reporting can tell you what’s happening, but it can rarely help you act on it.
There are many ways you can check the numbers, but there’s a chance you need to toggle between multiple platforms and do most of the work yourself. An ecommerce analytics platform brings together major insights which can then be used to trigger personalized emails, SMS, or push campaigns.
Many ecommerce analytics tools are fine for checking the numbers, but you’re left to do most of the work yourself. For example, if analytics show abandoned carts are spiking, you can send an automated follow-up that brings those shoppers back.
4. Get a full view of your business
Ecommerce data is all around. It’s in your store, email, social channels, ads, and customer service platforms.
A dedicated analytics platform consolidates all of this data into one place. Instead of jumping between dashboards, you get a single, clear view of your business. This way, it’s easier to spot trends and connect the dots between marketing, sales, and customer behavior.
5. Uncover trends and stay ahead of the curve
Your data holds stories if you know where to look. Maybe certain products sell better in specific seasons, or repeat buyers always return after getting a follow-up email.
Having your ecommerce analytics in one place can help you spot trends in customer behavior, product performance, and market demand. When you have a good grasp of what’s hot, you can work from a proactive rather than reactive position. This means you can meet demand before your competitors catch on.
6. Optimize pricing for profitability
Finding the sweet spot between price and profit is always tricky. But ecommerce analytics makes it less of a mystery. By tracking purchase data, customer responses, and competitor trends, you can quickly understand which prices and pricing strategies drive conversions and stretch your margins.
7. Improve the customer experience
Every click, purchase, and interaction is a window into how your customers experience your brand. An ecommerce analytics platform gives you a clear view of what’s working and where customers are dropping off. It might be a slow check-out process or confusing product pages—whatever it is, your analytics will uncover it.
With this information, you can remove any friction and create a butter-smooth experience that effortlessly propels shoppers towards that all-important “Buy now” button.
Measuring ecommerce performance: what to measure and how
When you have a detailed understanding of your ecommerce performance, you can see what’s driving growth and where you’re losing opportunities. But to do that, you need to uncover the right metrics and know how to use them.
1. Start with your core metrics
While there are many, many metrics you can measure, there are a few key numbers you should track regularly.
Revenue
Your revenue is the total sales your store generates over a certain period.
How to calculate
- Add up all the sales generated over a specific period (e.g., daily, weekly, monthly, or yearly).
- If you have an ecommerce platform like Shopify or a platform like Klaviyo, your analytics dashboard will usually display revenue automatically.
Conversion rate
Your conversion rate is the percentage of visitors to your site that actually make a purchase. If the number is low, you might need to optimize parts of the customer journey.
Formula
Conversion rate = (Number of purchases / Number of website visitors) x 100
How to calculate
- Count the total number of website visitors in a set period.
- Count the total number of purchases (or completed transactions) in that same period.
- Divide the number of purchases by the total visitors, then multiply by 100 to get the percentage.
For example, if you had 5,000 visitors and 150 purchases in a month:
Conversion rate = (150/5000) x 100 = 3%
Average order value (AOV)
Your average order value is how much customers spend on average per order.
Formula
AOV = Total revenue / Total number of orders
How to calculate
- Add up your total revenue over a set period.
- Divide that number by the total number of orders during the same period.
For example, if you made $10,000 in revenue from 200 orders:
AOV = 10,000/200 = $50
Customer lifetime value (CLV)
Your customer lifetime value is how much a customer is worth to your business over time.
Formula
CLV = AOV x Purchase frequency x Average customer lifespan
How to calculate
- Determine your AOV.
- Determine your purchase frequency, or the average number of purchases a customer makes over a given period (e.g., per year).
- Determine your average customer lifespan, or the average time a customer continues to purchase from you (e.g., in years).
For example, if your AOV is $50, customers purchase 3 times per year, and they typically stay for 2 years:
CLV = 50 x 3 x 2 = $300
Cart abandonment rate
Your cart abandonment rate is the percentage of shoppers who add items to their cart but don’t complete the purchase. A high abandonment rate usually signals friction in your check-out process or uncertainty somewhere in the sales cycle.
Formula
Cart abandonment rate = (Number of carts created – Number of purchases / Number of carts created) x 100
How to calculate
- Track the total number of shopping carts created on your website.
- Track the number of those carts that result in completed purchases.
- Subtract the number of purchases from the total carts, divide by total carts, and multiply by 100.
For example, if 500 carts are created and only 150 result in purchases:
Cart abandonment rate = (500 – 150 / 500) x 100 = 70%
Customer acquisition cost (CAC)
Your customer acquisition cost is how much it costs you on average to acquire a new customer.
Formula
CAC = Total marketing spend / Number of new customers acquired
How to calculate
- Add up all your marketing costs (ads, campaigns, tech, etc.) over a set period.
- Count the number of new customers you acquired in that period.
- Divide your marketing spend by the number of new customers.
For example, if you spent $2,000 on marketing and acquired 100 new customers:
CAC = 2,000 / 100 = $20
Customer retention rate
Your customer retention rate is the percentage of customers who come back and purchase from you again.
Formula
Retention rate = (Customers at end of period – New customers acquired / Customers at start of period) x 100
How to calculate
- Track the number of customers you had at the start of a set period.
- Subtract the number of new customers acquired during the period.
- Divide the remaining number by the customers at the start, then multiply by 100.
For example, if you started with 500 customers, acquired 100 new ones, and ended with 550:
Retention rate = (550 – 100 / 500) x 100 = 90%
Net profit margin
Your net profit margin is how much profit you make after accounting for marketing and operating expenses.
Formula
Net profit margin = (Net profit / Total revenue) x 100
How to calculate
- Subtract your total expenses (product costs, marketing, and operational costs, etc.) from your total revenue.
- Divide your net profit by total revenue, then multiply by 100.
For example, if your revenue is $10,000 and expenses are $7,000:
Net profit margin = (10,000 – 7,000 / 10,000) x 100 = 30%
2. Break it down by customer segments
Not all customers are the same. By analysing your metrics by segment (new vs. returning customers, location, or product preferences), you can uncover trends and make smarter decisions within each group.
For example, if returning customers have a much higher CLV, you know it’s worth investing in retention strategies like loyalty programmes or targeted email campaigns.
With Klaviyo, this segmentation goes deeper and gets smarter. You can build customer segments based on recency, frequency, and monetary value (RFM) analysis. You can then track the full customer journey through the funnel, filtered by segments.
You can then measure performance for these specific customer groups, track their behavior across channels, and tailor your marketing to resonate with each segment—so you know not only what’s happening, but also how you can act on it.
3. Measure marketing performance alongside sales
Your sales numbers are handy, but they don’t tell the full story. To understand how your marketing drives performance, you need to measure things like:
- Email open and click rates: Are your messages getting through and prompting action?
- Campaign revenue: How much revenue can you attribute to specific campaigns or automations?
- Return on ad spend: What’s the difference between how much you’re spending on ads and how much revenue you’re making from those ads?
4. Look at the full customer journey
Ecommerce performance is based on every interaction a customer has with your brand, both on- and off-site. How are they finding you? What channels bring in the best customers? Where are they dropping off?
A platform like Klaviyo can help you pull together this journey. You can see how customers move from an email to your website, which products they browse, and where they might drop off the path to purchase, so that you can optimize conversions along the way.
Ecommerce data sources: where to find your ecommerce analytics
Your ecommerce business generates a ton of data, but it comes from multiple sources—not all of which are obvious at first glance. Knowing where your data lives and how to access it is what gives you the full picture of your business and customers.
1. Your ecommerce platform
Shopify, BigCommerce, WooCommerce—whatever you use, your ecommerce platform is a useful primary data source.
What you’ll find here:
- Sales data: total revenue, AOV, and individual transaction details
- Order trends: which products sell best, what times sales peak, and how seasonality affects buying patterns
- Customer data: shipping details, purchase history, and frequency of repeat purchases
This is foundational data for measuring performances and understanding the basics of your customer behavior. But it’s limited on its own (more on this later). It tells you what happened, but not why. That’s where integrating this data with a platform like Klaviyo becomes invaluable.
2. Website analytics
Your website is where all the action happens. It’s where customers browse, consider, and, yes, sometimes drop off. Tools like Google Analytics, Hotjar, or your built-in website analytics give you a deeper insight into how people interact with your online store.
What you’ll find here:
- Traffic data: how many visitors land on your site, where they came from, and which pages they visit
- Engagement metrics: bounce rates, session duration, and which pages drive the most conversions
- Conversion funnels: where customers drop off in the purchasing process—cart abandonment, check-out issues, or product page hesitations
3. Marketing and advertising channels
Every marketing channel you use—email, SMS, paid ads, social media—produces valuable data that shows you how well your campaigns are performing and how customers are engaging with your brand.
What you’ll find here:
- Email and SMS engagement data: open rates, click rates, conversions, and customer responses
- Paid advertising data (e.g., Meta Ads, Google Ads): impressions, clicks, cost per click (CPC), and return on ad spend (ROAS)
- Social media insights: engagement rates, follower growth, and top-performing posts or campaigns
4. Product and inventory data
Managing your inventory and understanding product performance is so important for optimising your store. Tools like inventory management software or your ecommerce platform’s product data dashboard can provide these insights.
What you’ll find here:
- Stock levels: how much inventory you have and when to reorder
- Product performance: which products are selling well (and which aren’t)
- Profitability: margins on specific items and the cost of goods sold (COGS)
5. Customer support tools
Your customer service platform holds powerful data on the problems customers face and their overall satisfaction with your brand.
What you’ll find here:
- Support tickets: common issues or complaints
- Resolution time: how quickly problems are addressed
- Customer feedback: reviews, satisfaction ratings, and survey responses
6. Payment processors
Tools like Stripe, PayPal, or Klarna provide data on transaction success, failed payments, and refund trends.
What you’ll find here:
- Payment success rates: completed transactions vs. failed ones
- Refunds and charge-backs: how often orders are refunded or disputed
- Preferred payment methods: which options customers use most
7. Other third-party apps and integrations
If you use tools for loyalty programmes, shipping, reviews, or personalization, they produce valuable data. For example:
- Loyalty apps: insights into repeat customers and reward usage
- Shipping tools: delivery times, costs, and order fulfillment rates
- Review platforms: customer sentiment and product satisfaction
Bringing it all together
As you can see, you can find data in all sorts of crevices. The real power lies in consolidation.
That’s where a platform like Klaviyo stands out. Klaviyo integrates with your ecommerce platform, advertising channels, and other parts of your tech stack to bring all your data into one place. Instead of sifting through disconnected reports, you get a single, clear view of your business.
Ecommerce analytics is the window to your (brand’s) soul
Ecommerce analytics can feel heavy and overwhelming. But once you realize it’s just a fancy phrase for understanding your business better, it becomes a whole lot easier to stomach—and also a whole lot more important.
When you know what to measure and how to act on it, you can quickly turn raw data into tangible results. Whether you want to segment your audience to build personalized campaigns or spot trends to stay ahead of demand, the right insights give you the power to grow smarter.
But basic ecommerce analytics tools often limit growing brands because they’re…well, basic. If you want to get a full picture across all your platforms (we’re talking ads, email, SMS, website, social, etc.), you need an advanced platform like Klaviyo, which pulls your ecommerce data from multiple sources into one easy-to-digest dashboard.

Related content

With potential tariffs creating uncertainty and threatening profit margins, here are 3 ways marketers can use Klaviyo to stay resilient and protect profits in any economy.
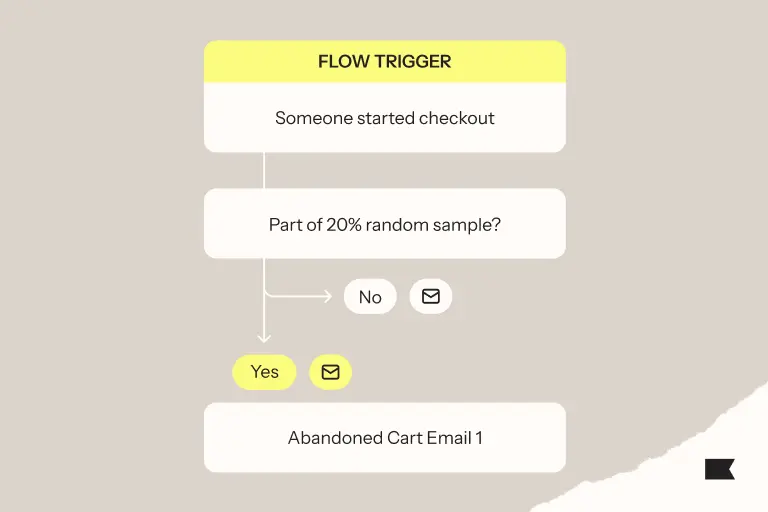
Discover how random sample branching can take your A/B testing to the next level. Learn 6 powerful use cases to improve your email and SMS performance.

Discover how implementing marketing analytics can lead to immediate improvements in customer segmentation, campaign effectiveness, and ROI.